
Open Ports
Open Ports is the inventory of every listening service ShadowMap found on your internet-facing IP addresses. It answers the question every attacker asks first: what is reachable, and what is running on it? Each row is an exposed IP with its full port/service breakdown — protocol, service, product, version, CPE, and banner — so you can spot the RDP box, the exposed database, or the forgotten admin panel before someone else does.
Overview
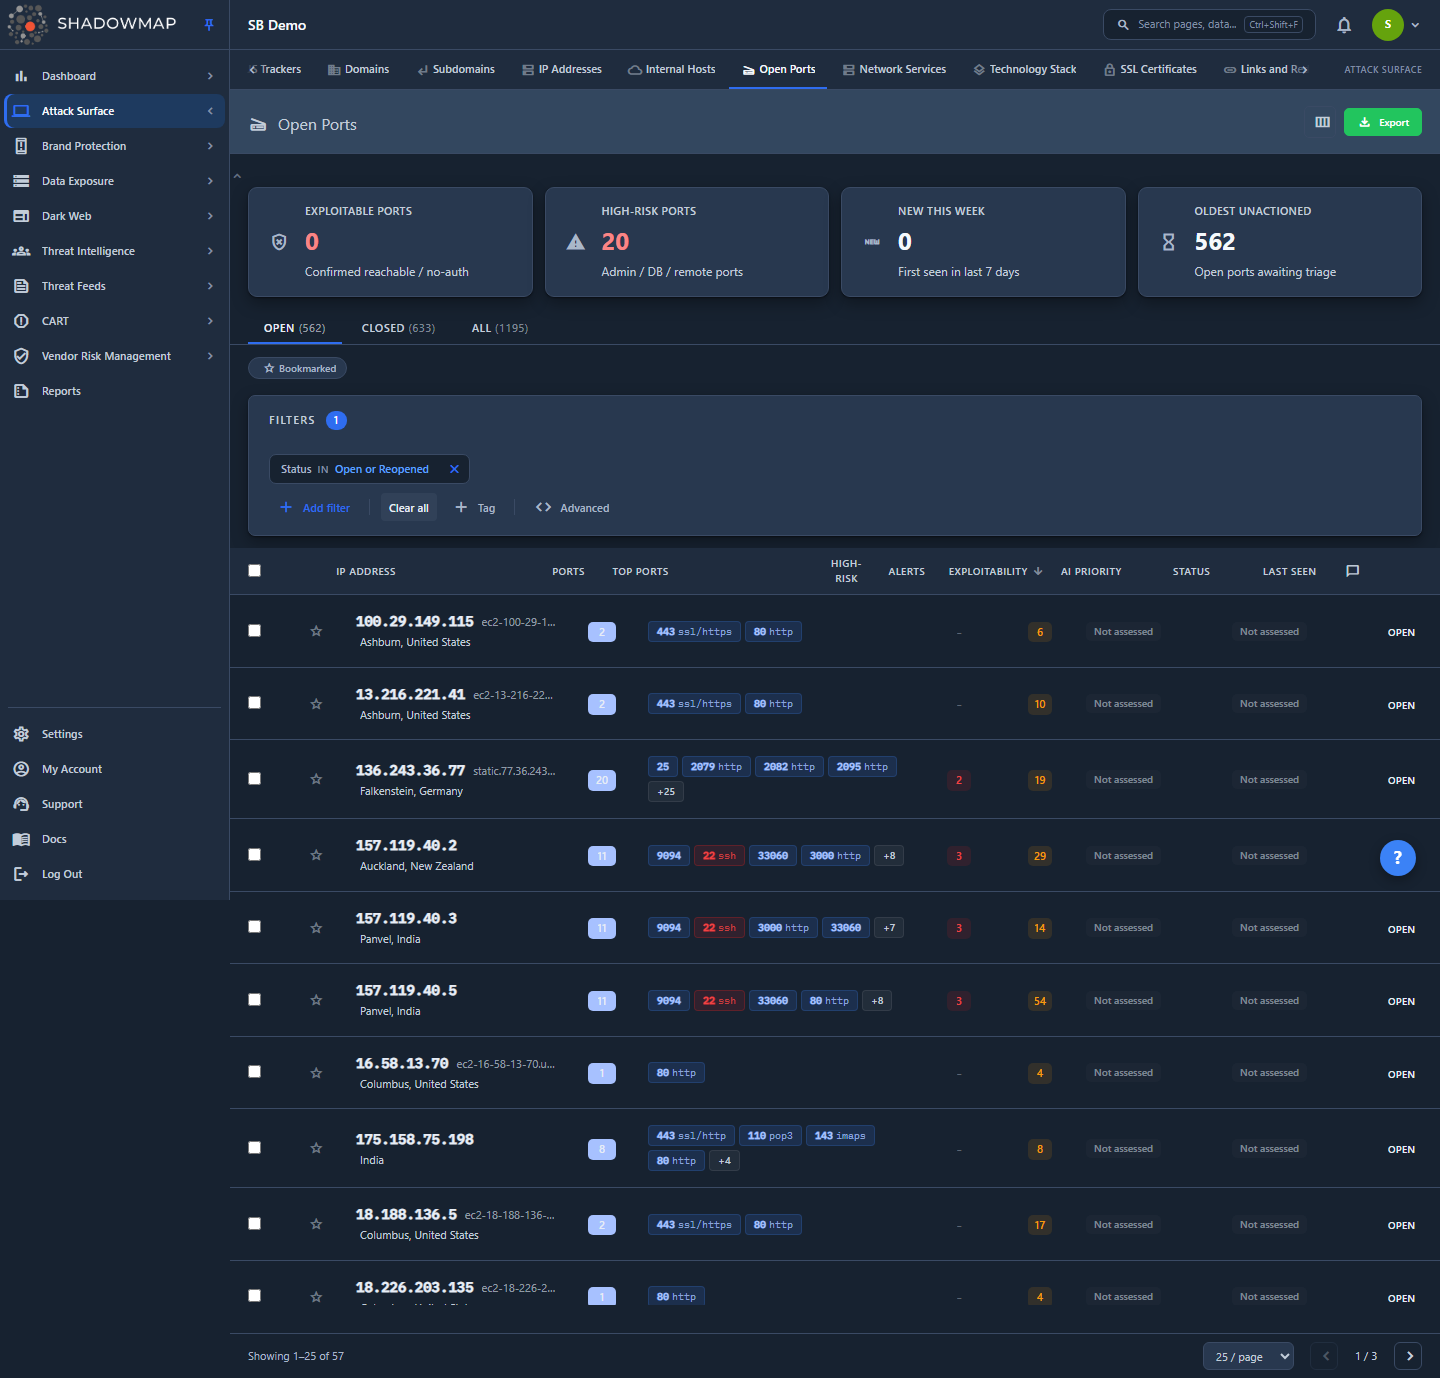
The page lists one row per IP address, not per port. Each row rolls up all the ports observed on that host: a port-count badge, the top ports as inline chips (high-risk ones in red, closed ones struck through), a high-risk count, linked alerts, an exploitability pill, an AI-priority badge, status, and first/last-seen timestamps. The IP cell shows reverse DNS, geolocation (with country flag), and the hosting provider/ASN.
Above the table, four KPI cards (the metrics strip) surface the port-exposure signals worth triaging next — each card is clickable and applies a matching quick-filter — and three tabs — Open, Closed, All — switch the universe you are looking at. The default view is the Open tab: currently-open IPs awaiting triage.
Ports-first metrics, IP-grouped table
This is an intentional and important quirk. The table rows are IPs (one host per row), but the KPI cards and tab badges count port rows. A single IP with 12 open ports is one table row but contributes 12 to the Open tab badge and to the Oldest Unactioned card (both count open port rows). The badge/card numbers will therefore be larger than the visible row count — that is by design, not a bug. Tiles describe port exposure; the table is your host worklist.
How it works
These are the mechanics you cannot infer from the UI alone.
Where the data comes from
Port data is produced by ShadowMap's external scanner against the IP addresses in your confirmed asset inventory, then summarized into two tables that this page reads:
summarized_ips— one row per IP, carrying the IP-level triage status (Open / Reopened / Closed), reverse DNS, geolocation, and provider/ASN.summarized_open_ports— one row per (IP, port), carrying protocol, service, product, version, CPE, banner, a port status (Open / Closed), and acreated_atfirst-observed timestamp.
The list query groups summarized_open_ports rows under their parent IP, so each table row is a host with its nested port list.
Two different "statuses" — don't conflate them
There are two status concepts on this page, at two different levels:
| Concept | Lives on | Values | What it means |
|---|---|---|---|
| Triage status (IP level) | the IP row | New, Open, Reopened, Closed | Your workflow state for the host — the Status column and the Open/Closed/All tabs key off this. |
| Port status (port level) | each port chip / detail row | Open, Closed | Whether that specific port was observed listening on the last scan. Closed ports are shown struck-through. |
The Open tab is defined as triage status IN (Open, Reopened); the Closed tab is triage status = Closed; the All tab applies no triage filter. Closing a host (triage = Closed) is a triage decision and does not change what the scanner reports — a host you closed will keep its open ports until the scanner stops seeing them.
High-risk ports
A port is flagged "high-risk" when it appears on a fixed list of services that are dangerous to expose to the internet. The same list drives the red chips, the High-Risk column count, the per-port "High" risk badge in the detail view, and the High-Risk Ports KPI card:
| Category | Ports |
|---|---|
| Remote access / shell | 22 (SSH), 23 (Telnet), 3389 (RDP), 5900–5902 (VNC), 512/513/514 (rsh/rlogin/rexec) |
| File transfer / sync | 20/21 (FTP), 69 (TFTP), 873 (rsync) |
| File sharing / RPC | 111 (rpcbind), 2049 (NFS), 135 (MSRPC), 137/138/139 (NetBIOS), 445 (SMB) |
| Directory / naming | 161 (SNMP), 389 (LDAP) |
| Databases | 1433 (MSSQL), 1521 (Oracle), 3306 (MySQL), 5432 (Postgres), 6379 (Redis), 5000, 27017/27018 (MongoDB) |
High-risk is about exposure, not a CVE
A high-risk flag means "this service should rarely be reachable from the public internet," not "this host has a known vulnerability." A patched, fully-hardened SSH on 22 is still flagged because exposing it broadens your attack surface. For vulnerability findings tied to a service, look at the Alerts column / tab.
Exploitability & AI priority
Two enrichment signals re-rank your worklist without ever changing what the scanner reports or hiding a port.
Exploitability comes from ShadowMap's live prober, which safely probes each open port out of band and writes a verdict per (IP, port). The row's Exploitability pill surfaces the highest-signal verdict across the host's ports, alongside a 0–100 exploitability score:
| Verdict | Pill | Meaning |
|---|---|---|
| Confirmed unauth with privileges | Exploitable (red) | Reachable and served privileged access with no authentication. |
| Confirmed unauth | Unauth (exists) (amber) | Reachable without authentication. |
| Confirmed live | Live (red) | Confirmed reachable and responding. |
| Inconclusive | Inconclusive (amber) | Probed, but the result was ambiguous. |
| not probed | Not assessed (muted) | The prober has not evaluated this host's ports yet. |
The Exploitable Ports KPI card, the N exploitable header pill, and the exploitable quick-filter all count the first three positive verdicts, scoped to open ports.
AI priority is a per-port AI-review verdict — Real Exposure, Needs Review, Likely FP, or Benign — carrying an AI score and optional AI tags. The AI Priority column shows the highest verdict across the host's ports; hover it for the per-port rationale. Ports with no verdict show Not assessed.
Both signals are pure enrichment: a port's Open/Closed scanner status and its presence in the Open/All universe are unaffected. Un-probed and un-reviewed ports always remain listed — they simply sort last.
AI priority in depth
Open Ports adds an AI-review pass on top of the scanner and prober. It deliberately does not use the "Filtered by AI" verdict-tab pattern you see in other modules. Here AI is a per-port priority signal — a badge and a score — so it re-ranks your worklist without ever hiding a port or changing what the tabs contain. There is no AI tab: the Open / Closed / All tabs stay pure scanner/triage facts, and AI rides alongside them in its own column.
Verdict bands. Each reviewed port gets one of four verdicts. They are ordered highest- to lowest-attention, and the badge is colour-coded to match:
| Verdict | Badge | What it signals |
|---|---|---|
| Real Exposure | Red | AI judged the exposure genuine and worth acting on — the top of your queue. |
| Needs Review | Amber | Ambiguous; the AI wants a human to make the call. |
| Likely FP | Slate | Probably a false positive — low priority, but not dismissed. |
| Benign | Grey | Expected/low-concern exposure. |
The AI Priority column surfaces the highest verdict across the host's ports, so a single genuinely risky service is never buried under quieter ones on the same IP. Next to the verdict, the badge shows that port's AI score (a numeric confidence/priority value). Ports the AI has not reviewed render a muted Not assessed chip — they are skipped for the badge but stay fully listed.
Notes tooltip. Hover the AI Priority badge to read the per-port rationale. Each reviewed port contributes one line in the form ‹port›: ‹verdict› — ‹note›, so you can see why a host was prioritised without opening the detail view.
AI tags. Beneath the badge, up to three deduplicated AI tags summarise the reviewed ports. Tags come from a controlled two-facet vocabulary:
| Facet | Tags |
|---|---|
| Service class — what the service is (blue) | Database, Admin Interface, Remote Access, Web, Mail, IoT, File Share, Directory Service, Network Infrastructure |
| Exposure posture — how it is exposed (amber) | Encrypted, Unencrypted, CDN, Expected, Legacy Protocol |
The vocabulary is controlled at both ends (the producer whitelists tags before storing them, and the UI drops anything outside the list, including the producer's none sentinel), so a chip only ever renders for a known tag.
Sorting by AI. Click the AI Priority column header to sort hosts by AI score, highest first; un-reviewed hosts sort last but never drop off the list. The list's default sort is a derived rank that leads with live-probe exploitability and uses AI score as the intra-tier tie-break, then recency — so the most reachable/dangerous hosts lead page 1, and AI priority decides the order among hosts of equal exploitability.
In the export. The asynchronous port export adds three AI columns — AI Priority, AI Score, and AI Tags — on each per-port row. They are purely additive: every port the query returns is still exported, and a port the AI has not reviewed shows - in all three columns. AI never narrows the export universe.
For how AI review works across ShadowMap — the verdict vocabulary, how scores are produced, and where the review sits in the pipeline — see AI Review.
What the KPI cards count
All four cards count open port rows (status = Open) in summarized_open_ports, scoped to your company. Each card is a clickable quick-filter: clicking one pins the Open tab and narrows the list to exactly the rows it counts, so the card value always matches the filtered list.
| Card | Definition |
|---|---|
| Exploitable Ports | Open port rows with a positive live-probe verdict (confirmed exploitable, unauth, or live — see Exploitability & AI priority above). The lead signal card; a matching N exploitable pill also appears above the table when the count is non-zero. |
| High-Risk Ports | Open port rows whose port number is on the high-risk list above. |
| New This Week | Open port rows first observed (created_at) in the last 7 days — newly-appeared exposure. |
| Oldest Unactioned | The open backlog — total open port rows awaiting triage. |
Because the tab badges and exposure counts derive from one query against the same port universe, Open + Closed = All holds exactly at the port-row level. (The metrics strip is collapsible; its collapsed state is remembered in your browser.)
Uniqueness and re-detection
A host is identified by its IP. When the scanner re-finds a host or a port it had previously stopped seeing, ShadowMap reopens it rather than creating a duplicate. Ports that disappear from a scan flip to port-status Closed but remain on the host's record (struck-through) so you keep the history of what was once exposed.
Understanding the data
List columns
Columns are customizable via the view-column button (top right); your selection is saved in your browser. IP Address is always shown. By default the list shows IP Address, Ports, Top Ports, High-Risk, Alerts, Exploitability, AI Priority, Status, Last Seen, and Comments; First Seen, Provider / ASN, Country, Applications, and Custom Tags are available but off by default.
| Column | Description |
|---|---|
| IP Address | The exposed host. Shows reverse DNS, country (flag + name), and provider/ASN beneath the IP. |
| Ports | Count of currently-open ports on this host (closed ports excluded). |
| Top Ports | Up to 4 port chips with service labels; high-risk in red, closed struck-through, plus a +N overflow chip. |
| High-Risk | Count of open high-risk ports on the host (red badge), or -. |
| Alerts | Count of open alerts linked to this IP. |
| Exploitability | The host's highest live-probe verdict as a pill (Exploitable / Unauth / Live / Inconclusive) with its 0–100 score, or "Not assessed". Sortable. |
| AI Priority | The host's highest AI-review verdict (Real Exposure / Needs Review / Likely FP / Benign) with its score and tags, or "Not assessed". Sortable. |
| Status | IP triage status: Open, Reopened, or Closed. |
| Last Seen | When the host was most recently observed (relative time). Sortable. |
| First Seen | When the host first appeared in your inventory. |
| Provider / ASN | Hosting provider / autonomous system. |
| Country | Geolocation of the IP. |
| Applications | Count of web applications mapped to this IP. |
| Custom Tags | Custom tag key/values applied to the host. |
| Comments | Comment count; click to jump to the host's Activity tab. |
IP triage statuses
| Status | Meaning |
|---|---|
| Open | Currently-exposed host in your active worklist. |
| Reopened | Was closed, then re-detected by a later scan. Treated as open. |
| Closed | You triaged this host as handled/accepted. Hidden from the Open tab. |
| New | Reserved in the data model for parity with other modules; new hosts are inserted as Open. |
Per-port fields (detail view)
| Field | Description |
|---|---|
| Port | Port number. |
| Protocol | TCP/UDP (defaults to TCP). |
| Service | Detected service (e.g., ssh, http, mysql). |
| Product | Detected software product. |
| Version | Detected version string. |
| CPE | Common Platform Enumeration identifier (hover for the full string). |
| Status | Open or Closed. |
| Risk | The live-probe verdict pill when the port was probed; otherwise "High" if the port is on the high-risk list. |
| Banner | Raw service banner text, shown in the Service Banners section when captured. |
Filtering & search
The search/filter bar supports structured rules across these fields:
| Filter | Use it to |
|---|---|
| Port | Find a specific port (e.g., 3389, 445). |
| Protocol | Narrow to TCP or UDP. |
| Service | Filter by detected service name. |
| Port Status | Open vs Closed at the port level. |
| Status | IP triage status (Open / Reopened / Closed). |
| IP Address | Locate a specific host. |
| Reverse DNS | Match on hostname. |
| Netblock | Scope to a CIDR/netblock. |
| Country | Filter by IP geolocation. |
| ASN / Provider | Filter by hosting provider or autonomous system. |
| First Seen | Date filter on first observation. |
| Exploitability | Filter by the live-probe exploitability assessment (enrichment only — narrows the view, never removes a port). |
Any custom tag keys defined for this module also appear as filter fields. The active tab's status preset is always applied first, and your own rules layer on top — so filtering Port = 3306 inside the Open tab shows currently-open hosts running MySQL.
Bookmarked-only view
The Bookmarked chip filters the current page to hosts you have starred. Bookmarking is per-row (the star icon) and is a fast way to build an ad-hoc working set during triage.
Columns with a sort arrow — Exploitability, AI Priority, and Last Seen — are sortable. (IP Address and Ports render as plain, non-sortable headers.) Page size is selectable (25 / 50 / 100).
Detail view
Clicking a row opens the IP detail page. The header shows the IP, its triage status, geolocation, provider, reverse DNS, and a stat strip (Ports, High-Risk, Alerts, Applications). Users with write permission get a status dropdown (Open / Reopened / Closed) to triage the host directly.
The detail page has four tabs:
| Tab | Shows |
|---|---|
| Ports | Full per-port table — port, protocol, service, product, version, CPE, status, risk — plus captured service banners. High-risk rows are marked with a red left border. |
| Alerts | Open alerts linked to this IP (risk score, title, host, port), each linking to the full alert. Paginated via "Load More." |
| Applications | Web applications running on this IP and the mapped hosts (subdomains) that resolve to it, each linking to Web Applications. |
| Activity | Comments and custom tags for the host. Add/remove tags and discuss findings with your team. |
Press Esc to return to the list. The list itself supports keyboard triage (j/k to move, Enter to open, Space to select, s to bookmark, ? for help).
Taking action
Select one or more hosts (row checkboxes, or select-all-on-page) to reveal the bulk action bar:
| Action | Effect |
|---|---|
| Acknowledge | Sets the selected IPs to triage status Open (the active/worklist state). |
| Close | Sets the selected IPs to Closed — removes them from the Open tab. |
| Add Tags | Opens the custom-tag modal to apply tag key/values to all selected hosts at once. |
| Assign | Assigns the selected hosts to a team member (searchable). |
| Clear assignee | Removes the current assignee. |
| Share | Shares the selection through your configured integration (Jira, Slack, etc.). |
Single hosts can also be re-triaged from the detail header's status dropdown. The whole list can be exported asynchronously via the Export button in the page header; the export respects your current filters and runs in the background so large datasets don't block the UI.
Closing a host is a triage decision, not a fix
Marking an IP Closed only changes its workflow state in ShadowMap. If the underlying service is still listening, the scanner will keep reporting it and may flip the host to Reopened on the next scan. Close hosts you have genuinely remediated or formally accepted as risk — don't use it to silence noise.
Common questions
Why is the open-port count bigger than the number of rows? The table lists one row per IP; the KPI cards and tab badges count individual port rows. A host with many open ports inflates the port count but is still a single row. This is intentional — see the callout in the Overview.
A port shows as Closed but the host is still in my Open tab. Why? Those are two different statuses. Port status (Open/Closed) reflects what the scanner last observed on that specific port. Triage status (the tab) reflects your workflow decision about the host. A host stays in the Open tab until you close the host, regardless of individual ports closing.
What makes a port "high-risk"? It is on a fixed list of services that are dangerous to expose publicly — remote access (SSH, RDP, VNC, Telnet), file sharing (SMB, NFS, FTP), databases (MySQL, Postgres, MSSQL, Redis, MongoDB, Oracle), and similar. It is about exposure surface, not a confirmed vulnerability.
How fresh is this data? Each host's First Seen / Last Seen reflects scanner observations. "New This Week" counts open ports first observed in the last 7 days. Re-detected hosts are reopened rather than duplicated.
How do I find all exposed databases (or RDP, or SMB)? Filter by Port (e.g., 3306, 3389, 445) or by Service, optionally combined with the Open tab. For a portfolio-wide view of dangerous exposure, watch the High-Risk Ports KPI card and filter Port Status = Open.
Where do vulnerabilities for a service show up? On the host's Alerts tab and in the Alerts column count. Open Ports tells you what is reachable; Alerts tells you what is wrong with it.
Related
- Alerts — the per-IP Alerts tab and Alerts column link straight into the alert workflow; vulnerabilities on exposed services live there.
- Network Services — a service-centric view that complements this host/port-centric one.
- IP Addresses — the source inventory of the IPs scanned here.
- Web Applications — the Applications tab and mapped hosts deep-link into web app detail.
- Vulnerability Overview — aggregate view of vulnerabilities across your attack surface, including those on exposed ports.
- Severity & Status — how triage statuses and severity work across modules.
- AI Review — the AI-review engine behind the per-port AI Priority badge, score, and tags documented above.