
Data Leaks
The Data Leaks overview (labelled Data Exposure in the product) is the landing page for everything ShadowMap finds where your organization's data, credentials, or infrastructure detail has spilled onto publicly reachable surfaces — leaked credentials, public code repositories, Docker registries, S3 buckets, document-sharing sites, exposed API endpoints, URL shorteners, and Elasticsearch instances. It answers one question fast: where is my data leaking right now, and how bad is it?
Overview
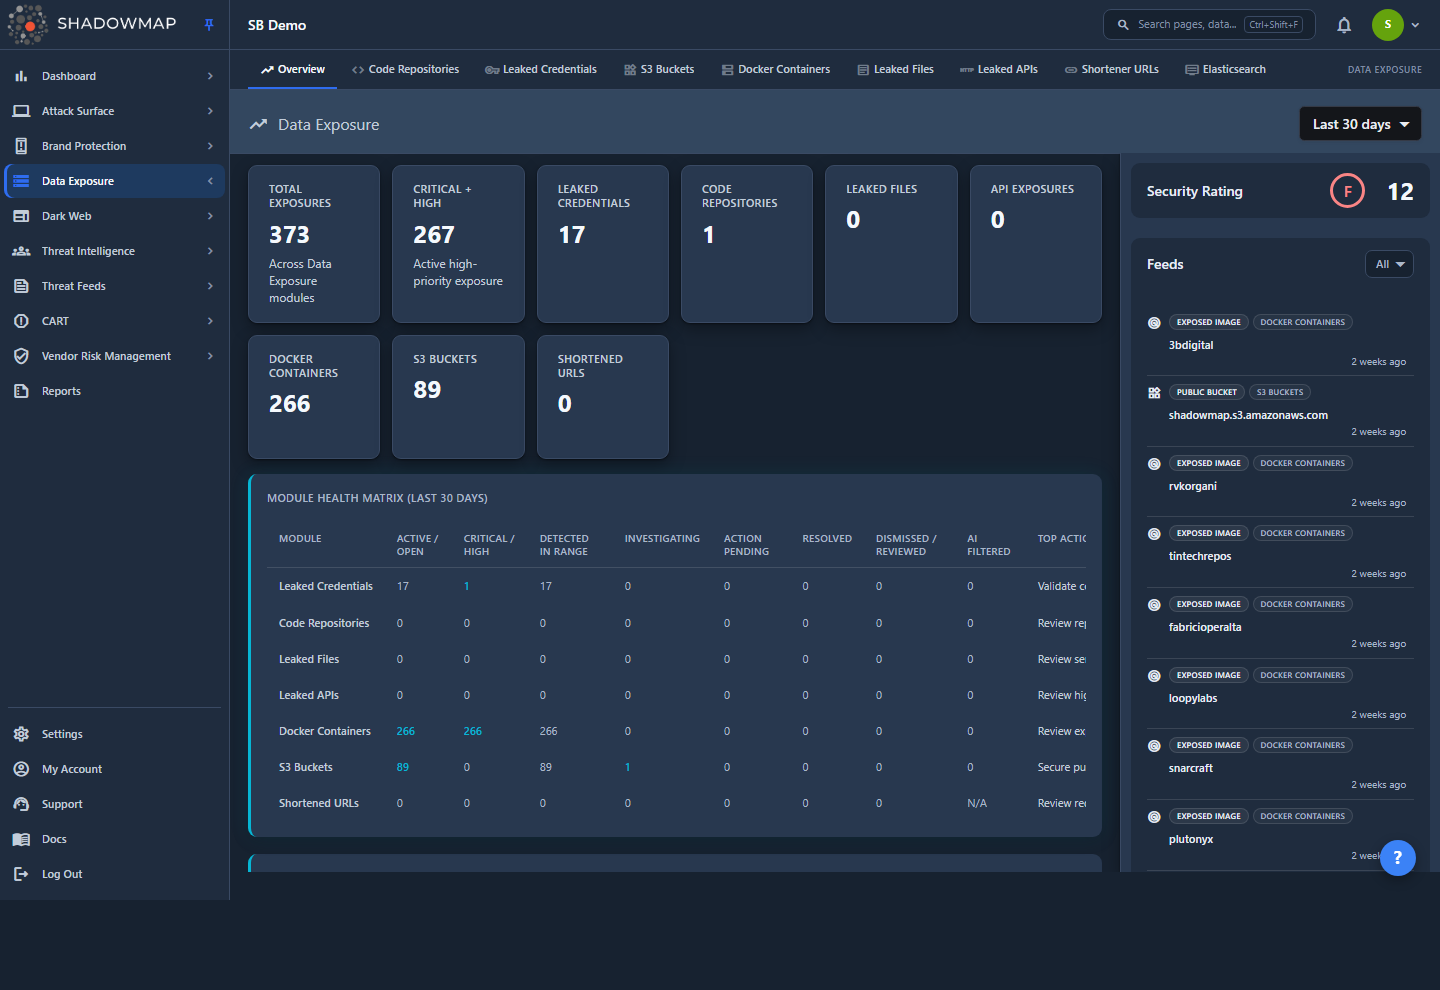
The page is a read-only dashboard, not a worklist. It rolls up the seven headline leak sources into one CISO/SOC-oriented view so you can triage from the top down. Reading top to bottom, it shows:
- A metrics strip of KPI cards: Total Exposures, Critical + High, then a per-module count for Leaked Credentials, Code Repositories, Leaked Files, API Exposures, Docker Containers, S3 Buckets, and Shortened URLs.
- A Module Health Matrix — one row per module across a shared set of lifecycle columns, so you can see posture and work-queue state side by side.
- A Program Impact panel — outcome tiles (total found, backlog, critical/high, resolved, AI-reduced, resolution success rate) plus a researcher-workflow row.
- Module Impact Graphs — a per-module lifecycle card ("found → open → in progress → actioned") for each source.
- A Recent Data Exposure Findings cluster — actionable findings surfaced in the last 7 days.
- A Data Exposure Summary — plain-language For CISO and For SOC Analyst briefs with a supporting module-mix donut.
- A Severity Distribution card — a stacked severity bar plus per-module critical/high breakdowns.
- A Leaked File Types donut with a threat-level summary.
- A Top Exposed Subdomains table merging the subdomains seen in leaked APIs and shortened URLs.
- A right-hand Feeds sidebar with the most recent finding from every module, plus this module group's Security Rating grade.
Every number, bar, badge, tile, and matrix cell is a jumping-off point: clicking through takes you to the individual module's filtered list, where the actual investigation and status work happens.
Where the detail lives
This overview summarizes; it never lets you change a finding's status. To review, dismiss, or action individual leaks, open the relevant module from the sidebar or by clicking a chart element. See Leaked Credentials, Code Repositories, S3 Buckets, Docker Containers, Leaked Files, Leaked APIs, and Shortened URLs.
How it works
The mechanics behind this page are not obvious from the UI — understanding them prevents you from misreading the numbers.
The time range filter drives everything
The dropdown in the page header (top right) is the single control for the whole page. It offers six presets:
| Preset | Window |
|---|---|
| Last 7 days | Findings seen in the last 7 days |
| Last 30 days | Findings seen in the last 30 days (default) |
| Last 90 days | Findings seen in the last 90 days |
| Last 6 months | Findings seen in the last 180 days |
| Last 1 year | Findings seen in the last 365 days |
| All time | Everything ShadowMap has ever found |
Each windowed module applies the range against its own date column (when a finding was first seen, leaked, or last updated, depending on the source), so the preset is a recency filter rather than a strict "first seen" cut-off. The Module Impact Graphs card also carries its own inline row of preset pills — these are a mirror of the header selector, so clicking one there re-scopes the whole page just as the header dropdown does.
Changing the preset re-fetches every card, matrix, graph, and the feed list. Your selection is remembered in the browser (per overview page) so you land on the same window next visit. The default is Last 30 days, which means the headline number you see on first load is not your all-time exposure — switch to All time for the full picture.
Two of the KPI counts are lifetime, not windowed
Most metric cards reconcile with the online / still-visible scope each module shows for the selected window. Code Repositories and Leaked Credentials are the exceptions: their KPI counts are deliberately lifetime (un-windowed), because data-leak exposure for those sources is treated as lifetime — threading the window in would make the card read 0 for a tenant whose repos or credentials predate the range while the module page still lists them. Code Repositories uses the same "visible" scope as its module page (excluding dismissed and offline findings), which is why its number can be much smaller than a raw database count. The Module Health Matrix, Program Impact, and Module Impact Graphs, by contrast, window every module by its own date column.
What each leak source is
The seven modules summarized here detect distinct classes of exposure:
| Module | What it finds |
|---|---|
| Leaked Credentials | Exposed username/password pairs and API keys for your domains, including validated still-working secrets. |
| Code Repositories | Public Git repositories (e.g. GitHub) carrying your code, internal references, or secrets. Each repo is scanned for leaked files and secrets. |
| Docker Containers | Public container registry images (e.g. Docker Hub) published under or referencing your organization, scanned layer-by-layer for leaks. |
| S3 Buckets | Publicly accessible cloud storage buckets tied to your brand. |
| Leaked Files | Documents exposed on file-sharing/paste sites and analysis platforms, classified by file type and a threat verdict. |
| Leaked APIs | API endpoints exposed in public sources, grouped by the subdomain they belong to. |
| Shortened URLs | Short links (bit.ly-style) pointing at your assets that expose internal or sensitive destinations, grouped by destination subdomain. |
Elasticsearch instances, Open Databases, and Stack Overflow leaks are also part of the Data Leaks module group and reachable from the sidebar, but they are not rolled into the headline metrics on this overview.
How "Total Exposures" is computed
The Total Exposures metric is the simple sum of the seven module counts (Code Repositories + Leaked Credentials + Docker Containers + S3 Buckets + Leaked Files + Leaked APIs + URL Shorteners). There is no de-duplication across modules — a piece of data that surfaces in two sources counts in both. Treat the total as a volume indicator, not a unique-incident count. Because Code Repositories and Leaked Credentials contribute lifetime counts while the other five window by the selected preset (see the tip above), the total blends lifetime and windowed volume.
No trend arrows on the KPI cards
The metric cards show a static value with no up/down trend indicator on the card itself. Don't read the absence of an arrow as "no change." To track direction over time, use the Program Impact panel (which reports resolved, AI-reduced, and resolution-success outcomes) or switch the time-range preset and read the numbers directly.
The Module Health Matrix
The Module Health Matrix is a single table with one row per module (Leaked Credentials, Code Repositories, Leaked Files, Leaked APIs, Docker Containers, S3 Buckets, Shortened URLs) across a shared set of lifecycle columns:
| Column | What it counts |
|---|---|
| Active / Open | Findings still needing review in that module |
| Critical / High | High-priority findings (for Leaked Credentials this is confirmed-working secrets) |
| Detected in Range | New findings inside the selected time window |
| Investigating | Findings currently marked under investigation |
| Action Pending | Findings queued for takedown / remediation |
| Resolved | Taken-down or no-longer-exposed findings |
| Dismissed / Reviewed | Findings dismissed, accepted, or marked reviewed / false-positive |
| AI Filtered | Findings the AI review filtered out of the queue |
| Top Action | The suggested next step for that module |
Every non-zero count is a deep-link that lands on the exact module tab that owns it, carrying the active time window through (unless the preset is All time). The matrix is horizontally scrollable on narrow viewports.
Program Impact and the researcher workflow
The Program Impact panel translates raw exposure into outcomes. Six tiles summarize the whole module group for the selected window:
| Tile | What it shows |
|---|---|
| Total Exposures Found | Everything detected in the selected range |
| Active Backlog | Findings still open across all modules |
| Critical / High | Aggregate high-priority exposure |
| Resolved / Offline | Removed or no-longer-exposed findings |
| AI Queue Reduced | Findings the AI review took off the queue |
| Resolution Success | Percentage of requested remediations that completed |
Below the tiles, a researcher-workflow row breaks the queue into Under Review, Pending Remediation, and Dismissed / Reviewed. Tiles and workflow items that resolve to a module deep-link into it; the aggregate tiles land on the module contributing the most to that count.
Module Impact Graphs
The Module Impact Graphs card renders one compact lifecycle card per module. Each card shows a Found total and three roll-ups — Open, In Progress (investigating + action pending), and Actioned (resolved + dismissed/reviewed + AI-filtered) — above a stacked lifecycle bar. The bar segments, keyed in the legend, are Open, Being reviewed, Action pending, Resolved, and Reviewed / AI filtered. Each card links to that module's work queue.
Recent Data Exposure Findings
Between the graphs and the summary, the Recent Data Exposure Findings cluster surfaces the actionable findings that appeared in the last 7 days, scoped to the Data Exposure category. This window is fixed at 7 days and does not follow the header time-range preset. When there is nothing new, it shows an empty state ("No new data leaks in the last 7 days").
The Data Exposure Summary
The Data Exposure Summary card replaces the old volume bar chart with two plain-language briefs plus a module-mix donut:
- A For CISO brief with a one-line headline (e.g. how many critical/high exposures need executive attention), a short explanation of where the exposure concentrates, and chips for total exposures, critical/high count, and active-module count.
- A For SOC Analyst brief that names the largest queue to start with and lists the top-priority modules by volume.
- A donut on the right showing the share of open exposure sitting in each module.
The counts and shares are derived from the same module totals and severities that drive the KPI strip.
Severity Distribution is per-module, and clickable
The Severity Distribution card covers five modules (Code Repositories, Docker Containers, Leaked APIs, S3 Buckets, URL Shorteners). Leaked Files and Leaked Credentials are not represented here — Leaked Files has its own Leaked File Types and Threat Level cards, and Leaked Credentials is tracked through the matrix and program-impact panels instead.
The card has three parts:
- A stacked severity bar with segments for Critical, High, Medium, and Low, summed across the five modules.
- A legend listing each band with its count and percentage of the period's findings.
- A per-module breakdown, one card per module, showing the module's total flagged findings, a critical/high summary pill, and a row of spelled-out severity badges (Critical, High, Medium, Low, and — where present — Informational).
The bar segments, legend entries, and per-module badges are all deep-links: clicking (or pressing Enter/Space) navigates to that module's list, pre-filtered to the chosen severity, with the active time window carried through unless the preset is All time. The destination tab is chosen per module so it contains the same population the badge counted — Code Repositories and Docker Containers land on their all tab, while Leaked APIs and Shortened URLs land on their online tab. The severity value is passed through in the module's own casing/type, so the filtered list matches the badge's count.
Leaked file types and threat levels
The Leaked File Types donut groups leaked documents by file type. Types are collapsed to a parent label (the first two words of the type string) so many granular MIME variants roll up into readable categories; unrecognizable hash-like type strings are bucketed as Unknown.
Below the donut, a Threat Level summary shows how many leaked files carry each verdict:
| Threat level | Meaning |
|---|---|
| Malicious / Suspicious | File flagged as a genuine threat (shown in red) |
| Ambiguous | Inconclusive verdict (shown in amber) |
| No Verdict / No Specific Threat | Scanned, nothing dangerous found (shown in green) |
| Unknown | No threat classification available |
Top Exposed Subdomains merges two sources
The Top Exposed Subdomains table combines the subdomains appearing in Leaked APIs and Shortened URLs into one ranked list (top 10 by count). It has three columns — Sub-domain, Source, and Count. The Source column tells you which feed each row came from — API or URL Shortener. Where ShadowMap can resolve the subdomain to an inventoried asset, the subdomain name links straight to its Asset Inventory detail page. This is the fastest way to spot a single subdomain that is leaking heavily across both channels.
The Feeds sidebar
The right sidebar shows a live, merged stream of the most recent findings across the six feed sources, newest first, with a relative timestamp and an icon per module. (The feed covers six of the seven headline modules — Leaked Credentials is not streamed here.) It paginates as you scroll and can be filtered to specific sources (Code Repositories, S3 Buckets, Docker Containers, Leaked Files, Leaked APIs, URL Shorteners) via the dropdown. Each feed item links straight to that finding — a detail page for Code Repositories and Docker Containers, and the module's list pre-filtered to that exact record for S3 Buckets, Leaked Files, Leaked APIs, and Shortened URLs. Above the feed, the Security Rating badge shows your letter grade and score for the Data Leaks module group — or a muted — if no score has been computed for your tenant yet.
Reading the page
| Element | What it tells you | Click target |
|---|---|---|
| Total Exposures card | Combined volume across all seven sources | Opens the largest contributing module's list |
| Critical + High card | Active high-priority exposure across modules | Opens the largest contributing module's list |
| Per-module cards (Leaked Credentials, Code Repositories, Leaked Files, API Exposures, Docker Containers, S3 Buckets, Shortened URLs) | Volume in each source | Opens that module's list |
| Module Health Matrix | Per-module lifecycle counts (active, critical/high, new-in-range, investigating, action pending, resolved, dismissed, AI-filtered) | Each non-zero cell opens the owning module tab |
| Program Impact tiles + workflow row | Outcomes: found, backlog, critical/high, resolved, AI-reduced, resolution success; plus under-review / pending / dismissed | Opens the relevant module list |
| Module Impact Graphs | Per-module found → open → in progress → actioned lifecycle | Opens that module's work queue |
| Recent Data Exposure Findings | Actionable findings from the last 7 days | Opens that finding |
| Data Exposure Summary | CISO/SOC briefs and the module mix of open exposure | — |
| Severity Distribution (bar, legend, per-module badges) | Critical/High/Medium/Low counts across five modules | Opens module list filtered to that severity |
| Leaked File Types donut | Distribution of leaked document types | — |
| Threat Level summary | How many leaked files are malicious/suspicious vs benign | — |
| Top Exposed Subdomains | Subdomains leaking the most via APIs and short links | Subdomain name opens its Asset Inventory detail |
| Feeds | Newest individual findings across every module | Opens that finding (detail page for repositories/containers, pre-filtered list for the other sources) |
Prerequisites
- Access to the Data Leaks overview requires the Data Exposure — Overview read permission (granted via your role); without it, the Overview link is hidden from the sidebar. Each other Data Leaks module has its own read permission, so the module group itself stays visible as long as you can see at least one of its pages. See Roles & Permissions.
- The overview only shows data once the underlying scanners have run for your organization and seeded the individual modules. New tenants will see empty-state cards and panels ("No severity data", "No leaked files", "No module impact data available yet") until the first scans complete, rather than misleading zeroes.
Common questions
Why is the total here smaller than what I saw last week? The page defaults to Last 30 days. If you opened it earlier on All time (or the selection was reset), the windows differ. The dropdown remembers your last choice per browser, but always confirm the active preset before comparing numbers.
The total doesn't match the sum I get adding up the module pages — why? The overview sums each module's online/visible scope with no cross-module de-duplication, and two of the seven (Code Repositories and Leaked Credentials) contribute lifetime counts while the rest window by the selected preset. Module list pages can also show different totals depending on which status tab you're on (e.g. "needs review" is a subset of "all"). When in doubt, click a metric card, matrix cell, or severity badge — it lands you on the exact filtered list that produced the overview number.
Can I dismiss or action a leak from this page? No. The overview is read-only. Click through to the module (via a KPI card, a matrix cell, a severity badge, a program-impact tile, or the sidebar) to triage, mark as investigating, or dismiss individual findings.
What's the difference between "Leaked Files" and "Code Repositories"? Leaked Files are individual documents found on sharing/paste/analysis sites. Code Repositories are whole public Git repos attributed to your org; ShadowMap scans inside each repo for both files and secrets. A secret found inside a repo is part of that repo's leaks, not the Leaked Files count.
Why don't the metric cards show a trend arrow? The KPI cards render a static value without a per-card up/down arrow. To follow direction over time, read the Program Impact panel (resolved, AI-reduced, and resolution-success outcomes) or compare windows by switching the time-range preset.
Where are Elasticsearch instances, Open Databases, and Stack Overflow leaks? They belong to the Data Leaks module group and are reachable from the sidebar, but they are not part of the headline metrics on this overview. Open Elasticsearch Instances, Open Databases, or Stack Overflow directly.
Related
- Leaked Credentials — exposed username/password pairs and keys for your domains; now one of the seven headline sources.
- Code Repositories — public Git repos leaking your code and secrets; one of the seven headline sources.
- S3 Buckets — publicly exposed cloud storage tied to your brand.
- Docker Containers — public container images scanned for leaks.
- Leaked Files — documents exposed on sharing and analysis sites, with threat verdicts.
- Leaked APIs — exposed API endpoints grouped by subdomain.
- Shortened URLs — short links exposing internal or sensitive destinations.
- Elasticsearch Instances and Open Databases — exposed data stores in the same module group, not summarized on this overview.
- Data Leaks Overview — the detailed overview page within the module group.
- Security Rating — how the Data Leaks grade shown in the sidebar is calculated.
- Severity Levels — what Critical/High/Medium/Low mean across ShadowMap.