
Attack Surface Area
Attack Surface Area (ASA) is the inventory of everything ShadowMap finds reachable from the public internet under your organization's name: web applications, mobile apps, SSL certificates, JavaScript trackers, login surfaces, and the infrastructure behind them. It is the answer to "what can an attacker actually see and touch?" — discovered continuously from your seed domains and brand, not from a list you maintain by hand.
Overview
The Attack Surface Area module opens on an Overview page — an "Attack Surface Findings" summary with one row per sub-module. The sidebar lists each ASA sub-module.
Opening the module (the /attack-surface-area route) redirects to a dedicated Overview page. It shows a single Attack Surface Findings cluster: one row per ASA sub-module — Web Applications, Mobile Applications, SSL Certificates, SSO, JS Trackers, CMDB Reconciliation, Cloud IAM, and Links & Redirects — each with its open-finding count and severity, and a click-through into that sub-module's list.
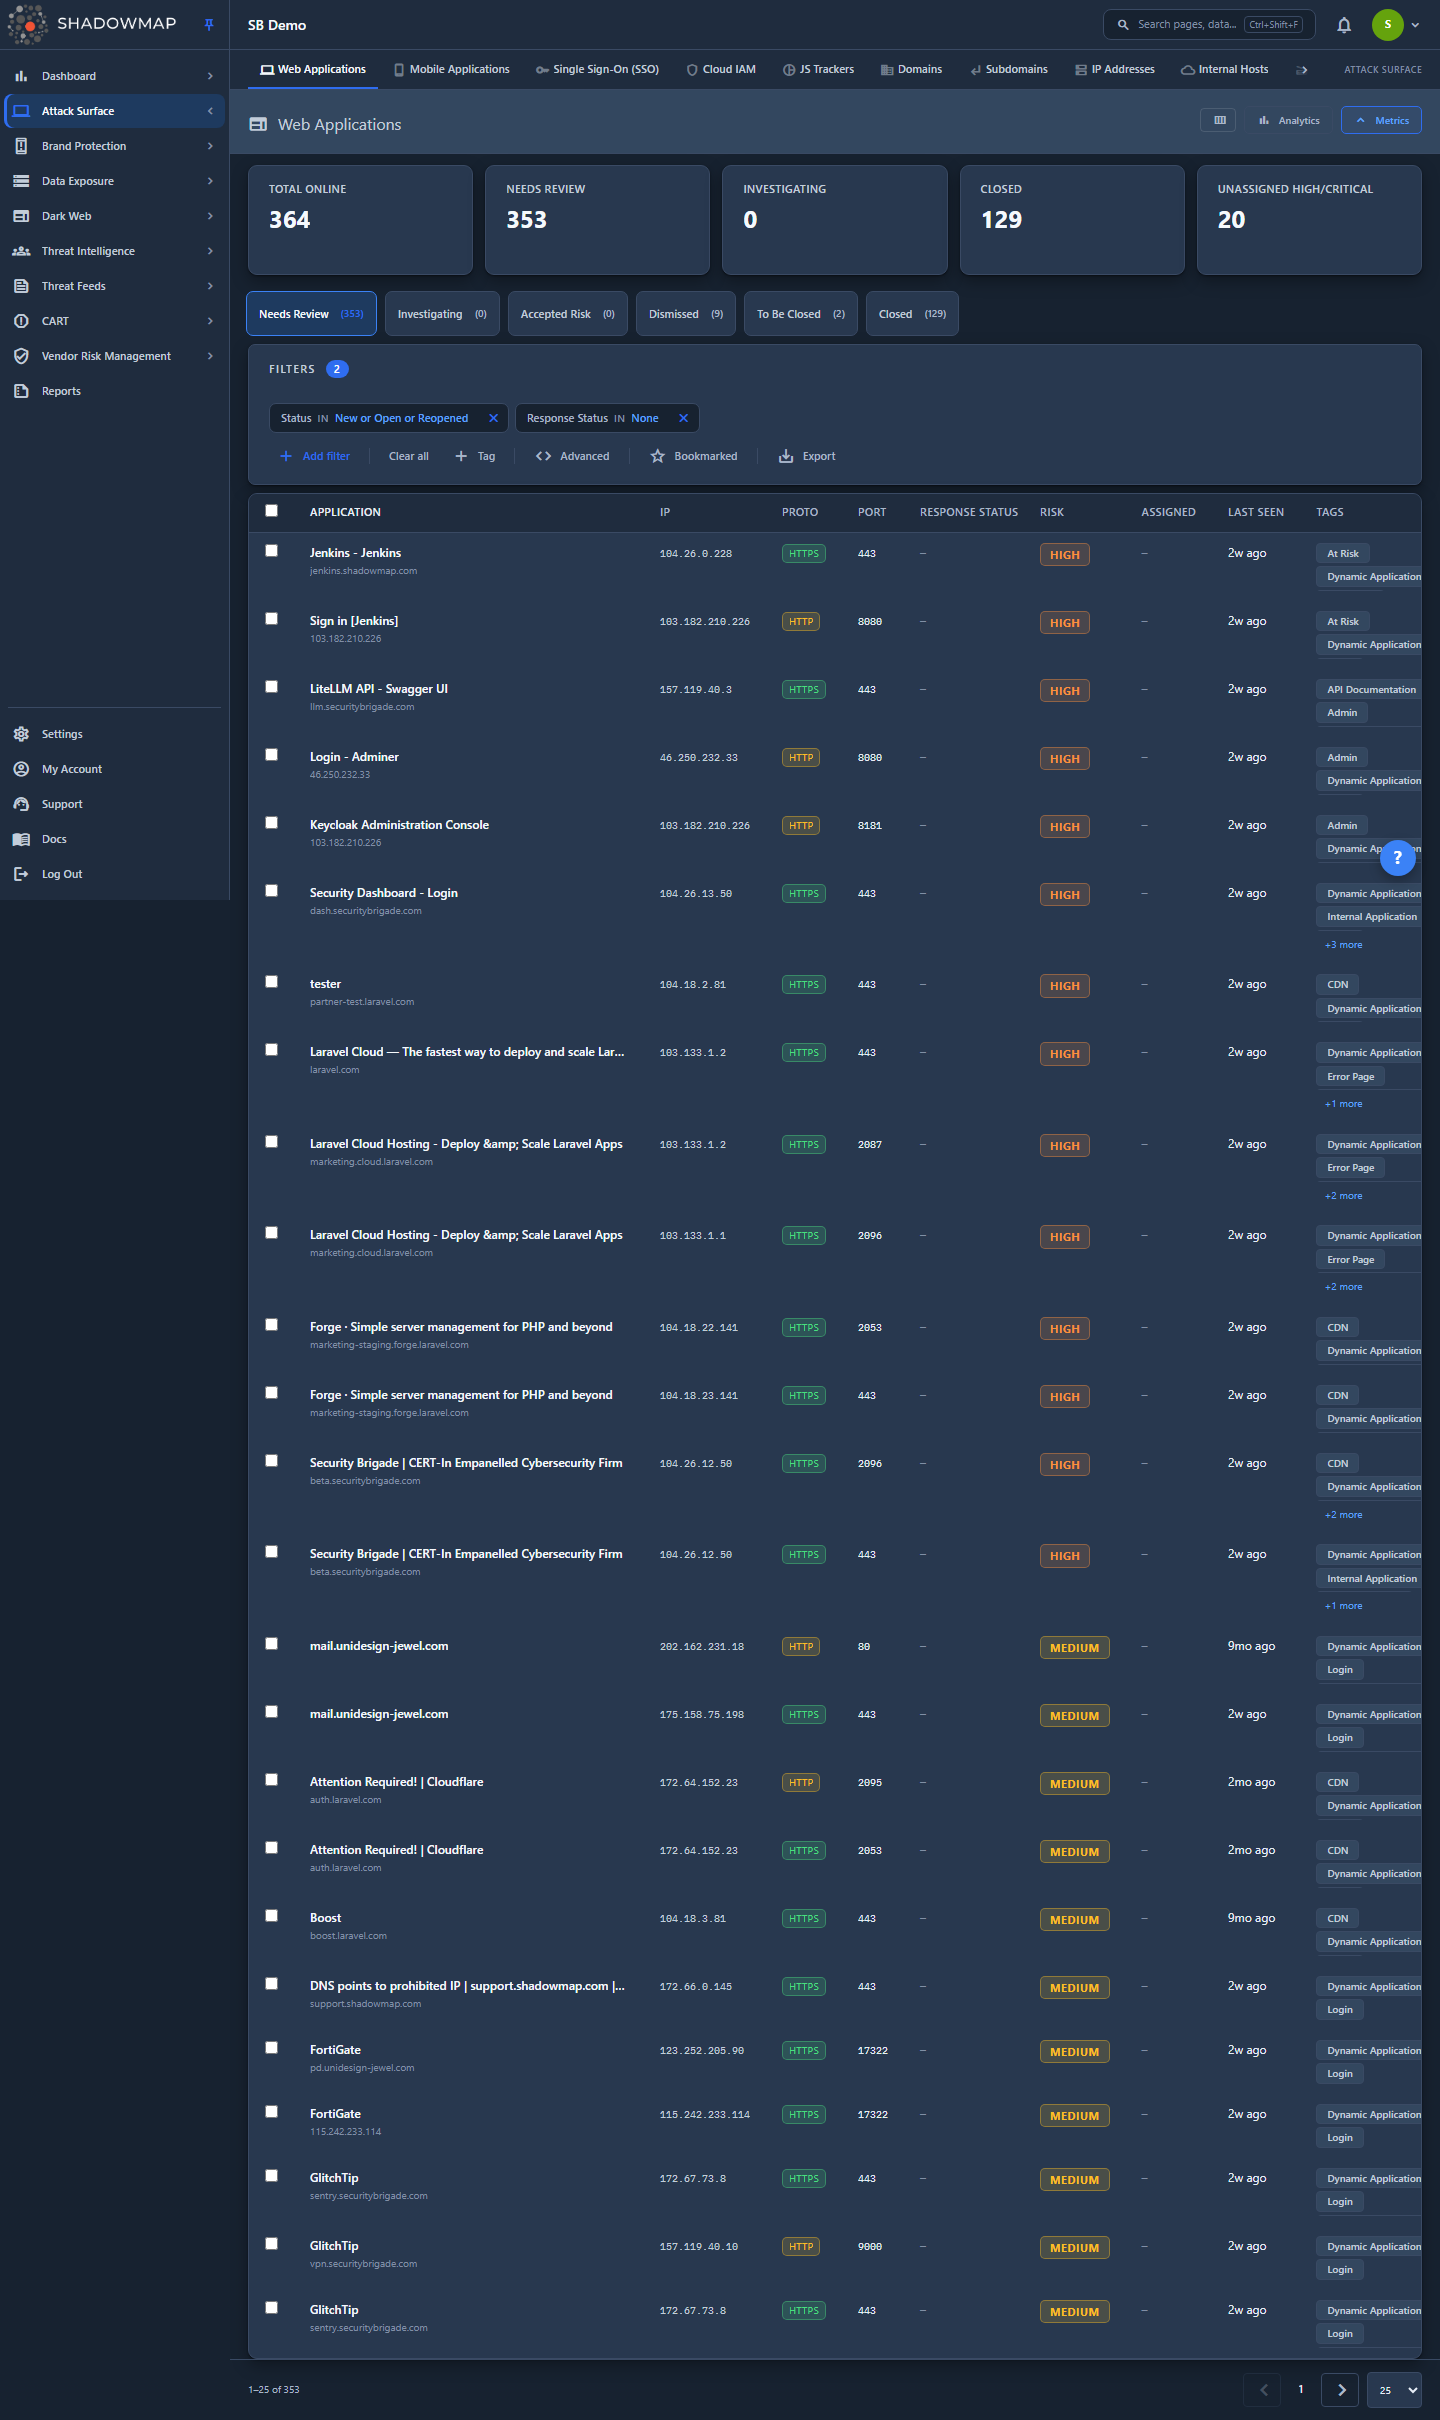
Every list sub-module shares the same layout and workflow: a metrics strip at the top, an optional analytics panel, status tabs, a filter bar, a sortable table, and a detail drawer. Web Applications is the largest and most-used; the rest of this page documents that shared pattern using it as the example. Learn it once and every sub-module behaves the same way.
ASA differs from the other ShadowMap modules in scope. Where Brand Monitoring tracks impersonation and Data Leaks tracks exposed secrets, ASA tracks your own legitimately-owned assets — the surface you are responsible for defending. A finding here is rarely "someone is attacking you"; it is "this is exposed, here is its risk, decide whether that exposure is acceptable."
Sub-modules
| Sub-module | What it inventories |
|---|---|
| Web Applications | Every HTTP/HTTPS endpoint discovered on your hosts — the default ASA view. |
| Mobile Applications | Apps published under your brand on app stores (official and third-party). |
| SSL Certificates | TLS certificates observed on your endpoints, with expiry and configuration issues. |
| JS Trackers | Third-party JavaScript and analytics tags loaded by your web apps. |
| Single Sign-On (SSO) | Identity-provider login surfaces detected on your applications. |
| Cloud IAM | Anonymous cloud-identity primitives (Cognito, Amplify, Firebase, GCP, Azure) embedded in your apps, live-probed for exploitability. |
| Links & Redirects | Outbound links and redirect chains found on your pages. |
| CMDB Reconciliation | Discovered assets reconciled against your CMDB to surface shadow IT. |
ASA also includes Cloud IAM — an inventory of anonymous cloud-identity primitives — which now appears in the sidebar as its own sub-module (same list layout, with a Needs Review / Investigating / Genuine tab set) when the Cloud IAM permission is enabled for your account.
How it works
These are the mechanics you cannot infer from the table alone.
Discovery is automatic and continuous
You never add an application to ASA manually. ShadowMap starts from your configured seed domains and brand, expands them into subdomains and IP ranges, then probes those hosts for live services. Every reachable HTTP/HTTPS endpoint becomes a Web Applications row; TLS handshakes feed SSL Certificates; page content feeds JS Trackers, SSO, and Links & Redirects. Scans run on a recurring cadence, so the inventory reflects the current state of your perimeter, not a one-time snapshot.
One row is one endpoint, not one URL
A Web Applications row is uniquely identified by the combination of protocol + IP + port + path (the backend keys each row on a hash of those fields). This is why the same hostname can appear on multiple rows:
http://example.com:80andhttps://example.com:443are two distinct findings — different protocol and port.- The same host served from two load-balanced IPs produces two rows.
Because the discriminator is the (proto, ip, port) tuple, the Proto and Port columns are shown by default. Without them, endpoint rows that differ only by protocol or port collapse into identical-looking lines.
Response status is an analyst decision, not an HTTP code
The Response Status column is the single most misread field in ASA. It is not an HTTP status code (200, 404, 500). It is the triage disposition a reviewer assigns to the finding — the answer to "what did we decide about this exposed app?" An untriaged finding shows —. See Response statuses below.
Risk is the priority of the exposure
The Risk column (Critical / High / Medium / Low) reflects how dangerous the exposure is — a more exposed or higher-value endpoint scores higher than a static page. Risk feeds the Unassigned High/Critical metric (High- and Critical-risk findings with no assignee) and is one of the dimensions exposure SLA policies act on.
Status vs. Response Status
ASA tracks two independent dimensions on every finding:
- Status — the lifecycle state of the finding:
New,Open,Reopened, orClosed. This is set by the platform (a newly discovered endpoint is New/Open; one that disappears and reappears is Reopened) and changes to Closed when you close it. - Response Status — your triage disposition (below), set by you. A finding can be
Openwith no response yet (it lands in Needs Review), orOpen+Investigating, and so on.
The status tabs combine both: most tabs filter to live findings (Open/New/Reopened) and then narrow by response, while Closed filters by status alone.
"Behind WAF" badge
A row may carry a Behind WAF badge when ShadowMap detects the endpoint is fronted by a Web Application Firewall or CDN. This is informational — it tells you the exposure is mediated, not that the underlying origin is safe.
Understanding the data
Status tabs
The tab bar segments the inventory by review state. Each tab shows a live count.
| Tab | Shows |
|---|---|
| Needs Review | Live findings with no triage response yet — your work queue. |
| Investigating | Live findings you have marked as under active investigation. |
| Accepted Risk | Live findings whose exposure you have formally accepted. |
| Dismissed | Live findings you have reviewed and dismissed as expected/acceptable (these carry the Reviewed response status). |
| To Be Closed | Live findings flagged for closure (e.g. decommissioned apps awaiting confirmation). |
| Closed | Findings that have been closed. |
TIP
Needs Review is the queue that matters day to day. When the Needs Review metric is non-zero it renders in red — that is the count of exposed apps nobody has looked at yet.
Response statuses
The values you assign in the Response Status column (and via the detail drawer's quick actions):
| Response | Meaning |
|---|---|
— (none) | Untriaged. Appears in Needs Review. |
| Investigating | Under active review; you are determining whether the exposure is intended. |
| Reviewed | Examined and dismissed as expected behavior. Findings you mark Reviewed are grouped under the Dismissed tab. (Displayed in place of the legacy internal value Public.) |
| Accepted Risk | Exposure is known and formally accepted; no further action planned. |
| To Be Closed | Marked for closure — the asset should be removed or decommissioned. |
Columns
The table is column-customizable (the column picker is in the page header). The Application column is always shown and locked.
| Column | Description | Shown by default |
|---|---|---|
| Application | Page title, or the host if no title is available. Shows the host as a subtitle and any Behind WAF badge. | Yes (locked) |
| IP | Resolved IP address of the endpoint. | Yes |
| Proto | HTTP or HTTPS — part of the row's unique identity. | Yes |
| Port | TCP port the service answers on. | Yes |
| Path | URL path of the endpoint. | No |
| Domain | Registrable (root) domain of the endpoint's host. | No |
| Response Status | Your triage disposition (see above). | Yes |
| Risk | Critical / High / Medium / Low priority of the exposure. | Yes |
| Assigned | Team member the finding is assigned to. | Yes |
| Provider / ASN | Hosting provider / autonomous system the IP belongs to. | No |
| Country | Geolocation of the endpoint. | No |
| Last Seen | When the endpoint was last observed live (relative time). | Yes |
| Tags | Security tags and your custom tags. | Yes |
| Technology | Technology-stack products fingerprinted on the application. | No |
| SSO Provider | Identity providers detected on the application's login surface. | No |
| JS Trackers | Third-party JavaScript trackers loaded by the application. | No |
Metrics strip
The cards across the top summarize the current inventory. Clicking a card applies its filter to the table.
| Metric | Meaning |
|---|---|
| Total Online | All live endpoints, across every response status. |
| Needs Review | Live, untriaged findings. Renders red when above zero. |
| Investigating | Live findings under investigation. |
| Closed | Findings that have been closed. |
| Unassigned High/Critical | High- or Critical-risk findings with no assignee — your backlog of important exposures nobody owns. Clicking it filters the table to exactly those findings. |
INFO
All five cards are clickable — selecting one applies its filter to the table. Total Online loads every live endpoint regardless of response, and Unassigned High/Critical narrows to unassigned High/Critical-risk exposures.
Filtering & search
The filter bar supports building compound queries with AND/OR conditions across 24 filter categories, including: Title, Status, Response Status, Risk, Domain, Host, IP, Netblock, ASN, Protocol, Port, Path, Country, Continent, SSO Provider, JS Trackers, Technology Stacks, Organization, Tag, Tag Rule, SLA Policy Violation, Assigned To, First Seen On, and Last Seen On.
Each status tab pre-loads the filter rules it represents (for example Needs Review seeds Status IN (New, Open, Reopened) and Response IN (None)), so the filter bar always shows exactly what the current tab is querying. You can edit or extend those rules without leaving the tab.
Two extra controls sit beside the filter bar:
- Bookmarked (star) — toggles the view to only findings you have bookmarked.
- Export — queues a background export of the current filtered result set.
TIP
Filter by ASN or Netblock to audit everything you expose from a single hosting provider or IP range in one pass — useful when migrating off a provider or after acquiring infrastructure.
Detail view
Click any row to open the detail drawer without leaving the list. The drawer shows the finding's Risk, Response, and Status badges, the full URL (opens in a new tab), application detail fields, and any custom tags. Quick-action buttons let you set the response in one click — Investigating, Reviewed, Accept Risk, and To Be Closed — plus an Assign control to route the finding to a team member.
For the full picture, open the application's dedicated page (the expand icon in the drawer header). The full page is organized into tabs:
| Tab | Shows |
|---|---|
| Overview | Overview of the application and its core attributes. |
| Infrastructure | The hosts, IPs, ports, and providers behind the application. |
| History | The finding's observed history over successive scans. |
| Compliance | Compliance-relevant attributes of the endpoint. |
| Activity | The audit trail of triage actions, status changes, and comments. |
Press j / k to move between findings in the drawer, Space to select, s to bookmark, and Esc to close.
Taking action
Select one or more rows (or Select all) to reveal the bulk action bar:
- Set response status — bulk-apply Investigating / Reviewed / Accept Risk / To Be Closed across the selection.
- Bookmark — flag findings for follow-up.
- Assign / clear assignee — route findings to a team member; the Assigned column and Unassigned High/Critical metric update accordingly.
- Add tag — apply a custom tag value to the selection.
- Share — push findings to a connected integration (e.g. ticketing) — see Sharing & Integrations.
Single findings can also be triaged from the detail drawer's quick-action buttons, commented on inline, and bookmarked from the row's star icon.
WARNING
Accepted Risk and Closed remove a finding from your active Needs Review queue, but ASA keeps scanning. If a closed endpoint is observed live again on a later scan its status flips to Reopened and it returns to the queue — accepting risk is a decision, not a permanent suppression.
Common questions
Why does the same application appear on several rows? Each row is one endpoint, keyed on protocol + IP + port + path. The same site on HTTP and HTTPS, on two IPs, or on two ports is genuinely multiple exposed endpoints, so it is multiple rows. Turn off the Proto and Port columns only if you have deduplicated mentally — they are the discriminator.
Is "Response Status" the HTTP status code? No. It is your triage disposition (Investigating, Reviewed, Accepted Risk, To Be Closed), not an HTTP response code. An untriaged finding shows —.
How do I find apps nobody has looked at? The Needs Review tab (or metric card) — live findings with no response yet. It shows in red when non-empty.
How is Risk calculated? Risk reflects the danger of the exposure based on what the endpoint runs and how reachable it is; an exposed admin/login surface scores higher than a static page. It drives the Unassigned High/Critical metric and SLA timing.
Do I have to add my own applications? No. Discovery is automatic from your seed domains and brand. If a legitimate app of yours is missing, it usually means a seed domain is not configured or the host was unreachable during the scan — see Missing assets.
What happens when I close a finding and the app is still live? It will return as Reopened on the next scan that observes it. To suppress a known, intended exposure permanently, use Accepted Risk rather than relying on Closed.
Related
- Web Applications — the default ASA view, documented in full.
- SSL Certificates — TLS inventory and expiry/config issues for these same endpoints.
- CMDB Reconciliation — reconcile discovered ASA assets against your CMDB to find shadow IT.
- Open Ports — the network-layer view of the same hosts (services and ports), complementary to ASA's application-layer view.
- SSL Issues — security findings derived from the SSL certificates inventoried here.
- Technology Stack — the technologies fingerprinted on these applications.
- SLA Policies — how the SLA clock and policy-violation filter are configured for exposure findings.
- Status Workflow — the platform-wide model of statuses and triage responses used across modules.