
Brand Monitoring
Brand Monitoring (labelled Brand Protection in the navigation) tracks how your brand, domains, executives, and apps are being abused outside your perimeter — phishing pages, look-alike domains, counterfeit mobile apps, impersonating social accounts, and executive targeting. The Overview is the module's summary surface — a CISO/SOC-oriented dashboard that rolls every brand-abuse category into one open-issue count, a cross-module health matrix, lifetime program impact, a severity breakdown, and a remediation (takedown) pipeline.
Overview
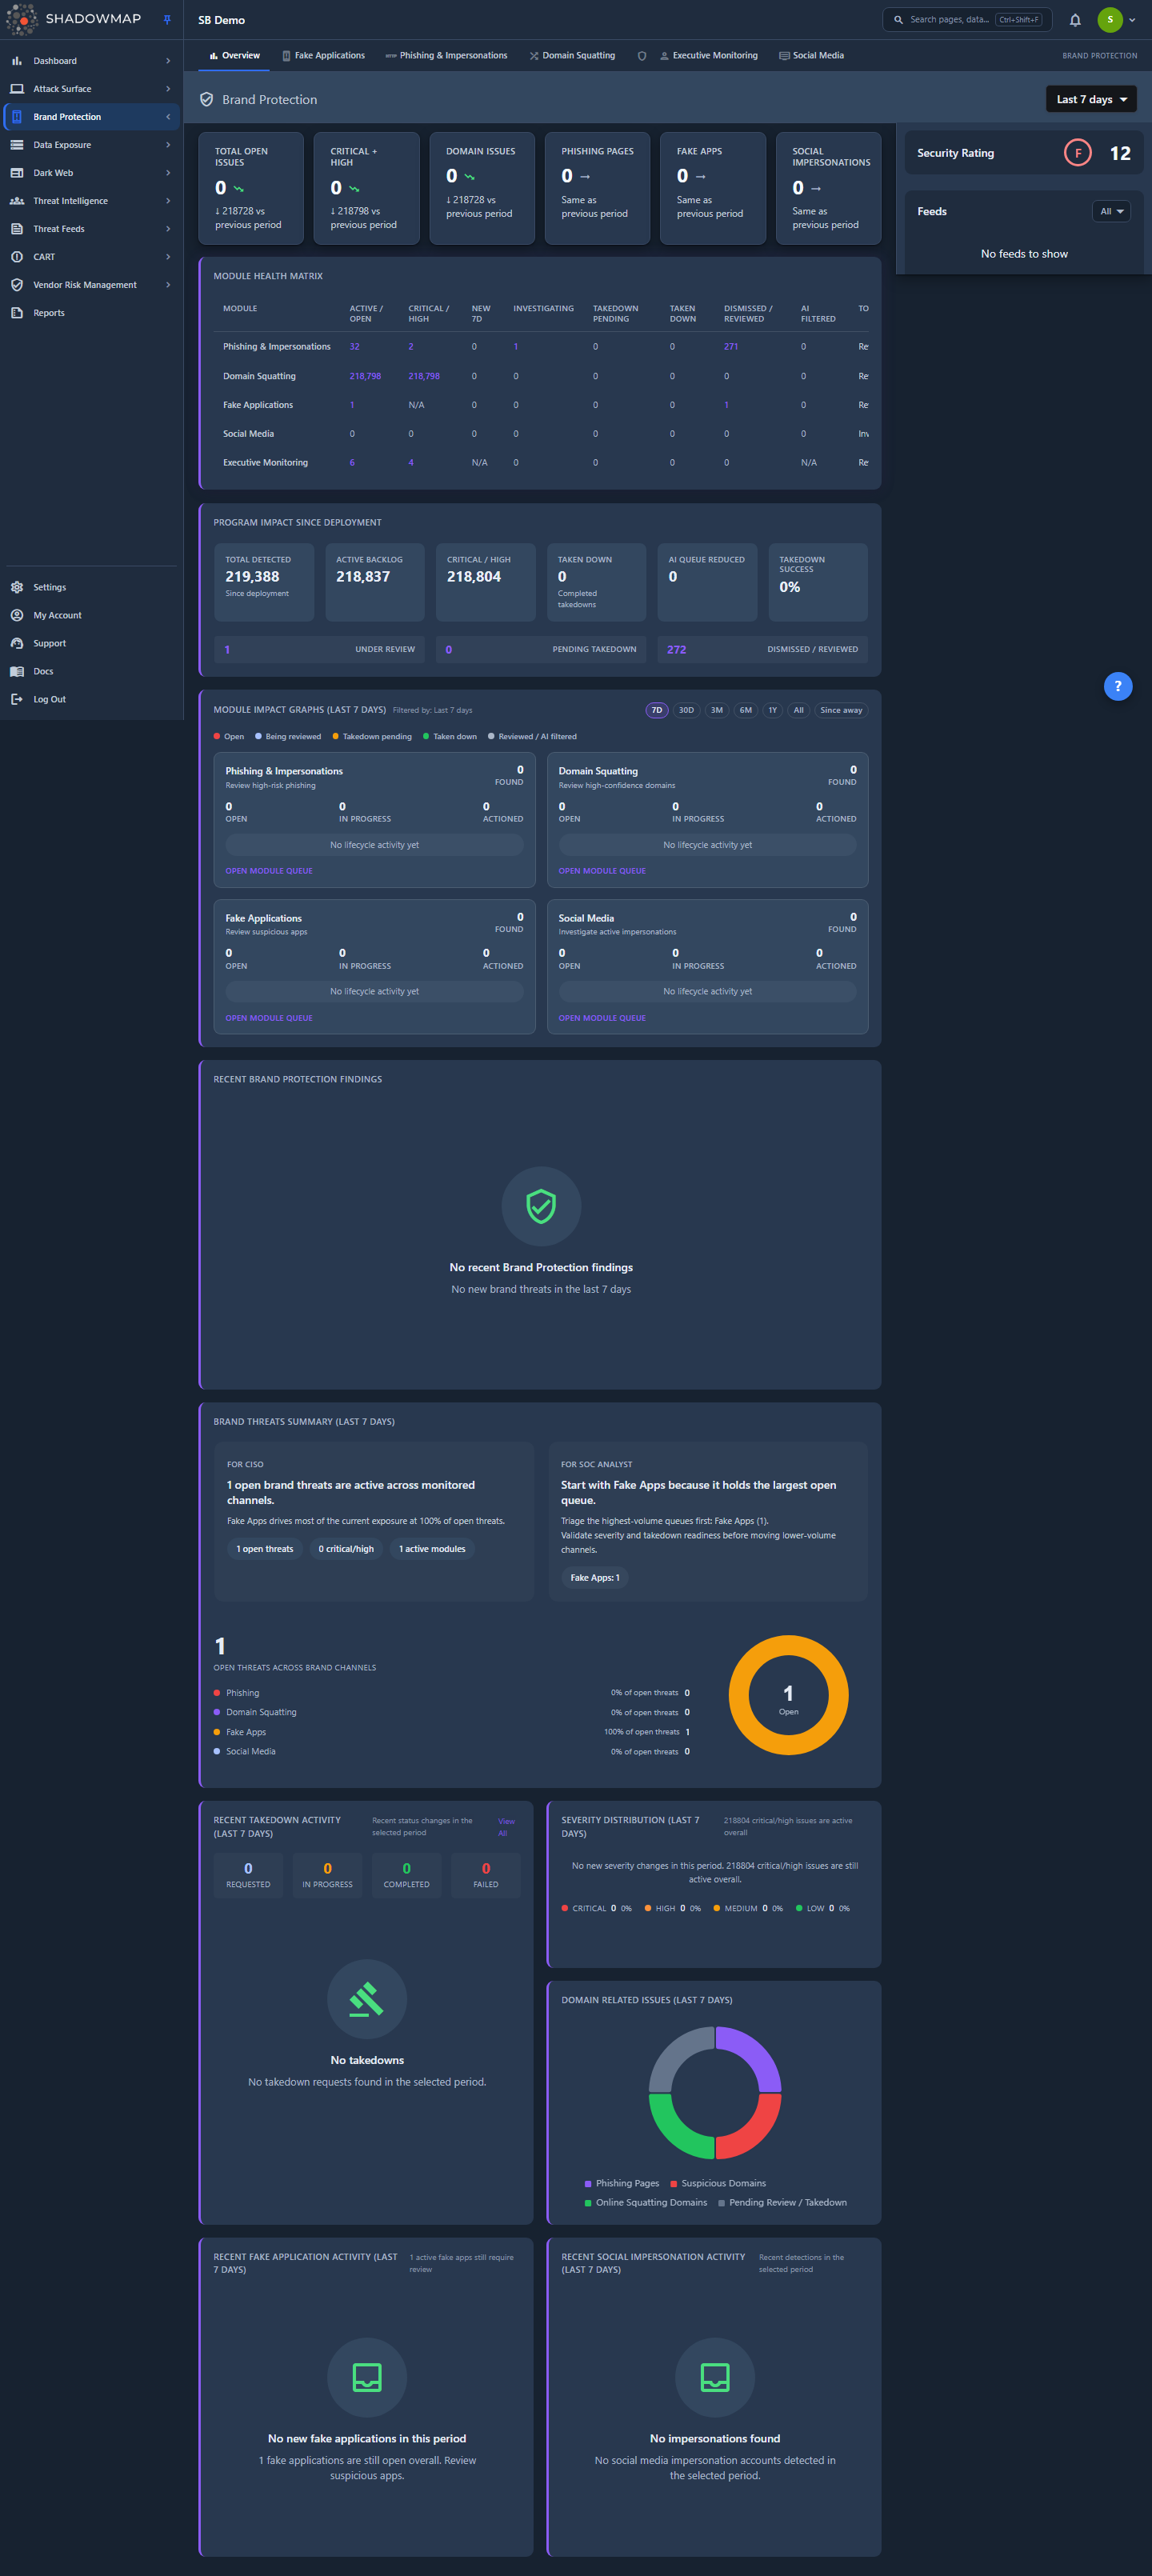
The Overview lives at /brand-monitoring/overview and is the first of the module's six tabs. Note that the bare /brand-monitoring route now opens to Phishing & Impersonations, not the Overview — reach this dashboard from the Overview tab. Each tab is a separate detail page:
| Tab | What it covers |
|---|---|
| Overview | This dashboard — aggregated KPIs, severity, takedown pipeline, and recent activity. |
| Fake Applications | Counterfeit / unauthorized mobile apps on the Play Store and App Store. |
| Phishing & Impersonations | Live phishing pages and impersonation URLs targeting your brand. |
| Domain Squatting | Look-alike / typo-squatted domains (cousin domains, homoglyphs, combosquats). |
| Executive Monitoring | Threats targeting named executives (impersonation, leaked data, fraud). |
| Social Media | Impersonating or fraudulent social media accounts. |
The page body stacks, top to bottom: a metrics strip of six KPI cards; a cross-module Module Health Matrix; a Program Impact Since Deployment panel of lifetime outcome tiles; Module Impact Graphs (one per module, scoped to the date range); a Recent Brand Protection Findings cluster; a full-width Brand Threats Summary; then a row pairing Recent Takedown Activity with a stacked Severity Distribution and Domain Related Issues; and a final row pairing Recent Fake Application Activity with Recent Social Impersonation Activity. A right-hand sidebar shows the module Security Rating and a chronological Feeds stream of new detections and takedown events.
A date-range selector (top right) scopes most of the page. Presets are Last 7 days (default), Last 30 days, Last 90 days, Last 6 months, Last 1 year, and All time, plus a Since you were away option that windows activity to everything since your previous session. Date-scoped cards show the active window in their title (e.g. Brand Threats Summary (Last 7 days)). Your selection is remembered per browser via local storage, so the module reopens at the range you last used — the Since you were away window is the one preset that is not restored this way. Changing the range reloads the date-scoped cards and the feed; the Module Health Matrix and Program Impact Since Deployment are lifetime posture and do not move with the range.
This page documents the Overview
The Overview is a summary surface. Each KPI and card links into a dedicated detail page where you triage, comment, change status, and request takedowns. Use the cross-links in Related to go deep on any category.
How it works
Most of what makes this dashboard trustworthy is not visible in the UI. These are the mechanics behind the numbers.
What "Total Open Issues" actually counts
The headline Total Open Issues KPI is the arithmetic sum of four disjoint module buckets:
Total Open Issues = Domain Issues + Phishing Pages + Fake Apps + Social ImpersonationsEach bucket counts a different set of rows, and no row appears in two buckets, so the total is a true unique-issue count — not a severity rollup. Severity (Critical / High / Medium / Low) is a breakdown of those same rows along a different dimension, which is why severity counts are never added on top of the module total. Two CI guardrails enforce these rules so the dashboard can't silently drift:
- Label-data match — every module-named card (Phishing, Fake Apps, Domain, Social) must read the count for that module, never a shared severity aggregate.
- Sum disjointness — the total must equal the sum of the four module buckets with no double-counting.
Why this matters
Earlier versions wired the "Phishing Pages" card to the cross-module critical severity figure. The card could read 13 while the phishing list held zero rows. The current build reads the same active-online phishing count the detail list uses, so the KPI and the list always agree.
The Module Health Matrix
Below the KPI strip, the Module Health Matrix puts one row per Brand Protection module — Phishing & Impersonations, Domain Squatting, Fake Applications, Social Media, and Executive Monitoring — against a shared set of lifecycle columns:
| Column | Meaning |
|---|---|
| Active / Open | Findings still awaiting your review. |
| Critical / High | High-severity subset; shows N/A for modules without a severity axis (e.g. Fake Applications). |
| New 7d | Detected in the last 7 days. |
| Investigating | Findings you have moved into an investigating state. |
| Takedown Pending | Takedowns requested but not yet resolved. |
| Taken Down | Successfully removed. |
| Dismissed / Reviewed | Closed as reviewed, false positive, or customer-owned. |
| AI Filtered | Auto-suppressed by AI review before reaching your queue. |
| Top Action | The recommended next step for that module. |
Every non-zero count is a link into that module's list, pre-scoped to the matching lifecycle tab, so the number you see is the number you land on. The matrix is lifetime posture — it is not affected by the date-range selector.
Program Impact and Module Impact Graphs
Two panels turn the same data into an outcomes story:
- Program Impact Since Deployment — lifetime tiles for Total Detected, Active Backlog, Critical / High, Taken Down, AI Queue Reduced, and Takedown Success (the share of resolved takedowns that were actually removed), plus a workflow row of Under Review, Pending Takedown, and Dismissed / Reviewed. Like the matrix, this is lifetime and ignores the date range.
- Module Impact Graphs — one card per actionable module (Executive Monitoring is excluded by design) showing Found / Open / In Progress / Actioned counts and a stacked lifecycle bar (Open, Being reviewed, Takedown pending, Taken down, Reviewed / AI filtered). Unlike the two panels above, these graphs follow the date range and carry their own quick-filter pills. Clicking a card opens that module's queue.
A Recent Brand Protection Findings cluster sits below the graphs, surfacing new, actionable brand-protection findings from the last 7 days regardless of the selected range.
How "Domain Issues" is aggregated
The Domain Issues KPI and the Domain Related Issues donut combine phishing and domain-squatting work into one figure. The total is a sum over non-overlapping buckets that represent work waiting on you:
| Bucket | Source |
|---|---|
| Phishing pages (online) | Active online phishing URLs |
| Online squatting domains | All resolving look-alike domains |
| Workflow domains | Squatting domains you have marked Accepted (a requested takedown is already counted under its online liveness bucket) |
| Needs-review domains | Squatting domains awaiting your triage decision |
The donut keeps four slices for visual stability — Phishing Pages, Suspicious Domains (high-risk online squatting, a highlighted subset of online), Online Squatting Domains, and Pending Review / Takedown. The "Suspicious Domains" slice is a subset of "Online Squatting Domains" and is shown only as a highlight; it is not added again into the total, which avoids the double-count that previously inflated this KPI.
How severity is rolled up
The Severity Distribution bar and the Critical + High KPI aggregate per-category risk scores into four levels. The mapping is fixed:
| Level | Contributing categories | Notes |
|---|---|---|
| Critical | Phishing (risk 4), Domain Squatting (critical) | Social media and fake apps do not contribute a Critical bucket here. |
| High | Social Media (high), Phishing (risk 3), Domain Squatting (high) | |
| Medium | Social Media (medium), Phishing (risk 2), Domain Squatting (medium) | |
| Low | Social Media (low), Phishing (risk 1), Domain Squatting (low) |
Each category exposes its own risk scale (phishing uses numeric risk 1–4; social media and domain squatting use named risk levels), and the Overview normalizes them into this shared Critical/High/Medium/Low view.
How the Takedown Pipeline is built
The Recent Takedown Activity card (formerly Takedown Pipeline) merges the most recent takedown records from all four sources — social media, fake apps, domain squatting, and phishing — into one timeline, sorted newest-first by the takedown-requested date. Its subtitle surfaces how many takedowns remain pending across modules. The four counters at the top of the card bucket every takedown by its status value:
| Counter | Status values that map to it |
|---|---|
| Requested | requested (plus any unknown / legacy value) |
| In Progress | ongoing, pending, awaiting |
| Completed | completed |
| Failed | denied, counter_notice, dismissed |
An earlier build matched status substrings (progress, fail, reject) that no status value actually contains, so In Progress and Failed were structurally always zero; the current build buckets the exact status values the backend sends. The table beneath shows the five most recent takedowns in three columns — Takedown Info, Module (which category they came from), and a Status badge. View All opens the full Takedowns queue.
The Feeds sidebar
The right sidebar streams brand events as they are detected, newest first, merged across all four categories: new social impersonations, new fake apps, new phishing pages, and takedown status changes. Each item links straight to the relevant detail view. Filter the stream with the All / Selected dropdown to show only Fake Applications, Domain Squatting, Phishing & Impersonations, or Social Media. The sidebar paginates as you scroll.
Security Rating
Above the feed, the sidebar shows the Brand Protection slice of your ShadowMap Security Rating as a letter grade and numeric score. If the tenant has no computed score yet, the widget renders a muted "—" placeholder rather than a false failing "F 0" grade. See Security Rating for how the score is derived.
Understanding the cards
| Card | What it shows |
|---|---|
| Total Open Issues | Sum of the four module buckets — the single number to track over time. |
| Critical + High | Count of Critical and High severity issues across the module. Trends "bad" when above zero. |
| Domain Issues | Combined phishing + domain-squatting open/workflow count (see aggregation above). |
| Phishing Pages | Active online phishing URLs — matches the Phishing detail list default view. |
| Fake Apps | Counterfeit mobile apps detected in the selected range. |
| Social Impersonations | Impersonating social accounts detected in the selected range. |
| Module Health Matrix | One lifecycle row per module with count-linked cells (lifetime, ignores the date range). |
| Program Impact Since Deployment | Lifetime outcome tiles plus an Under Review / Pending Takedown / Dismissed workflow row. |
| Module Impact Graphs | Per-module Found / Open / In Progress / Actioned stats and a stacked lifecycle bar; date-scoped. |
| Recent Brand Protection Findings | Actionable new findings from the last 7 days. |
| Brand Threats Summary | Plain-language CISO and SOC briefs, a total, a per-module breakdown with % share, and a supporting donut. |
| Severity Distribution | Headline summary plus a stacked bar and legend of Critical / High / Medium / Low counts. |
| Domain Related Issues | Donut of the four domain slices with a "total" subtitle. |
| Recent Fake Application Activity | Five most recent fake apps with their store (Play Store / App Store); "View All" if more. |
| Recent Social Impersonation Activity | Five most recent impersonations with platform icon, follower count, and a risk badge (C/H/M/L). |
| Recent Takedown Activity | Status counters + five most recent takedowns across all categories. |
Empty cards are normal
A card showing 0 or a "No data found" panel means nothing was detected for that category in the selected date range — not that the category is unmonitored. Widen the range (e.g. All time) to see the full history. The example screenshot is a demo tenant with most counts at zero.
Taking action
The Overview is read-only by design — it summarizes and routes. To act on a finding:
- Open the category. Click a clickable KPI card, a Module Health Matrix cell, a Module Impact Graph card, a card's View All, or any feed item to land on the pre-scoped detail page.
- Triage in the detail list. Each category page lets you set status, mark false positives, comment, and bookmark.
- Request a takedown. Eligible findings (phishing, squatting, fake apps, social impersonations) can be escalated to ShadowMap's takedown service. Track every request from the Recent Takedown Activity card here or the full takedown queue.
For the takedown workflow itself — statuses, evidence, and SLAs — see Takedowns.
Common questions
Why doesn't "Total Open Issues" equal the sum of the severity counts? They measure different things. The total is the sum of four module buckets (Domain, Phishing, Fake Apps, Social). Severity is the same rows re-sliced by Critical/High/Medium/Low. Adding severity on top of the module total would double-count every issue, so the two are deliberately kept separate.
The "Phishing Pages" KPI here is different from a number I saw elsewhere — which is right? The KPI reads the same active-online phishing count the Phishing & Impersonations detail list uses by default, so the two now agree. If you scoped that list with extra filters or a different date range, the counts will differ — match the date range first.
Why is "Suspicious Domains" smaller than "Online Squatting Domains" in the donut? "Suspicious Domains" is the high-risk online subset of "Online Squatting Domains," shown as a highlight. It is intentionally a subset and is not added separately into the domain total.
Does changing the date range affect every card? Almost. The range selector scopes the KPI strip, the Brand Threats Summary, Severity Distribution, Domain Related Issues, Module Impact Graphs, the takedown activity card, and the feed. Two panels are deliberate exceptions: the Module Health Matrix and Program Impact Since Deployment show lifetime posture and never move with the range, and Recent Brand Protection Findings always shows the last 7 days. The selection persists per browser, so the module reopens at your last-used range.
Why is my Brand Protection Security Rating showing "—"? The tenant has no computed Brand Protection score yet (for example, a newly onboarded account). The dashboard shows a muted dash instead of a misleading "F 0" until a score exists. See Security Rating.
Where do takedown statuses come from? The pipeline merges takedown records from all four categories and buckets them as Requested, In Progress, Completed, or Failed based on each record's status. Manage the full queue from Takedowns.
Related
- Phishing & Impersonations — the detail list behind the Phishing Pages KPI and donut slice.
- Domain Squatting — look-alike domains feeding the Domain Issues KPI.
- Fake Applications — counterfeit mobile apps shown in the Fake Apps card.
- Social Media — impersonating accounts behind the Social Impersonations card.
- Executive Monitoring — threats targeting named executives (appears in the Module Health Matrix, but not in the KPI cards, severity, or takedown widgets).
- Google Business Listings — fraudulent or hijacked business listings.
- Takedowns — the remediation workflow the Recent Takedown Activity card tracks.
- Security Rating — how the Brand Protection grade in the sidebar is calculated.
- Severity Levels — how Critical/High/Medium/Low are defined across ShadowMap.