
App Misconfigurations
App Misconfigurations is the focused queue for web-application and DNS/email-authentication configuration weaknesses on your internet-facing assets: applications flagged as risky by HTTP analysis, missing or weak security headers, and DNS/email-security posture gaps (SPF, DKIM, DMARC, DNSSEC, and open DNS recursion). It is a curated slice of the same engine that powers Alerts, narrowed to a fixed set of header/config and DNS-posture detection sources — so you can triage app and DNS hygiene without wading through network, certificate, credential, and dark-web findings.
Overview
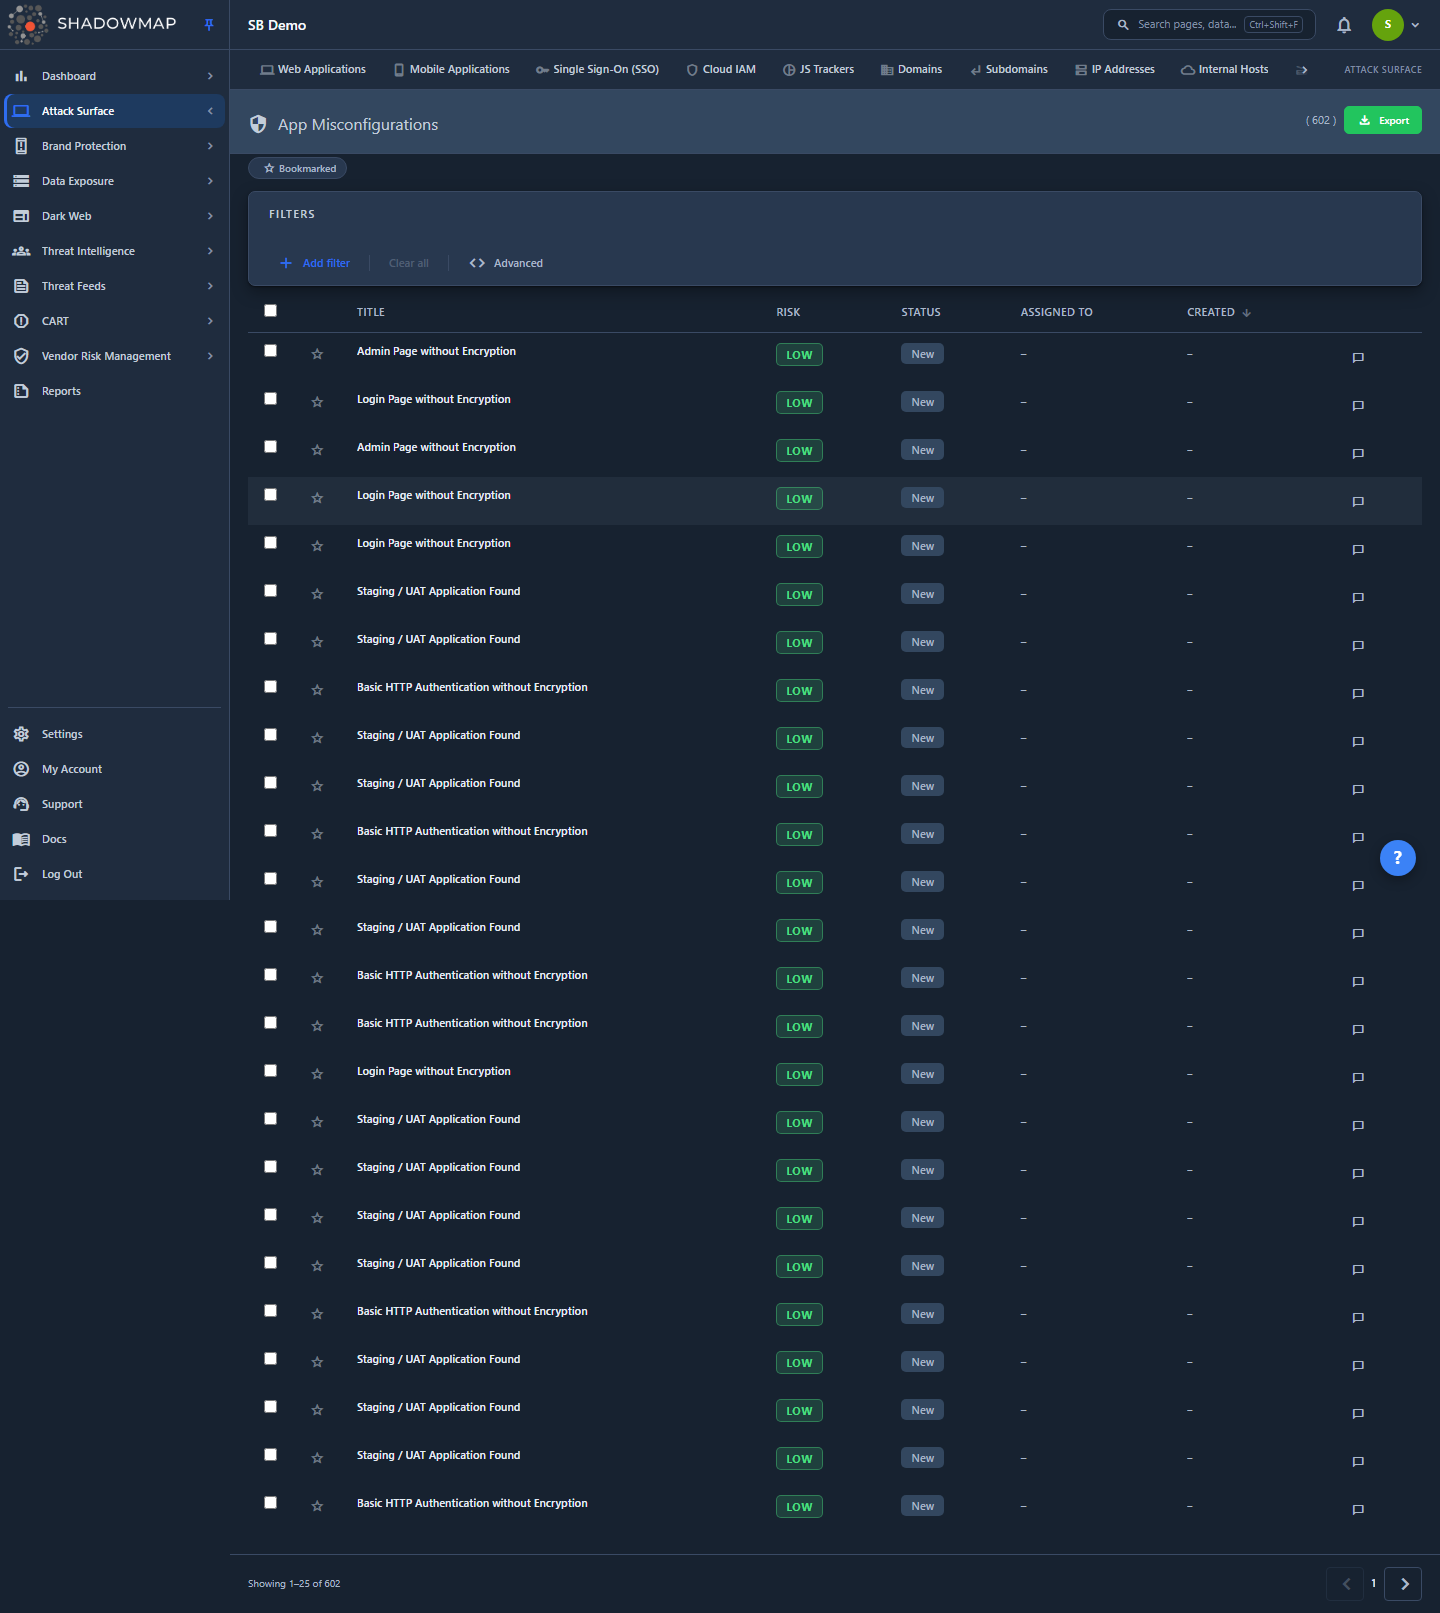
The page is a single sortable table of misconfiguration findings, one row per detected weakness. Working top to bottom:
- A page header showing the total count and an Export button.
- A Bookmarked filter chip that toggles the list down to items you have starred.
- A filter bar with category filters (Title, Risk, Status, Assignee, Source, Date) plus a free-text search.
- The findings table with a select-all checkbox, a bookmark star, and the columns Title, Risk, Status, Assigned To, and Created shown by default (a Source column is available but hidden by default). Each row has an inline comment thread; clicking a row opens its detail.
- Pagination at the bottom (25 rows per page).
Two things to understand before you use the page: every finding carries two independent statuses (what the scanner currently sees versus what your team decided), and the queue is deduplicated and auto-reopened so the same weakness never appears twice. Both are explained below.
How it works
These are the mechanics you cannot read off the screen.
What counts as an "app misconfiguration"
This module is not a separate scanner. It is the Alerts data store scoped to a fixed set of detection sources — the checks that surface web-application header/config weaknesses and DNS/email-authentication posture, kept separate from the sources a sibling module already owns (SSL/TLS, exposed ports and services, cloud storage). The detection sources that feed this queue are:
| Finding type | What it detects |
|---|---|
| At Risk Applications | Applications flagged as risky by HTTP analysis — login/admin pages served without encryption, basic-auth without encryption, staging/UAT apps reachable in production, dangerous server responses, and similar app-level red flags. |
| Missing Security Headers | Responses missing hardening headers (e.g. HSTS, Content-Security-Policy, X-Frame-Options, X-Content-Type-Options). |
| SPF & DKIM | Email-authentication DNS records (SPF, DKIM) that are missing or misconfigured. |
| DMARC | A missing or weak DMARC policy on your sending domains. |
| DNSSEC | DNSSEC not enabled or misconfigured for a domain. |
| DNS Recursion | A DNS resolver answering recursive queries from the public internet (an open resolver). |
| DNS Email-Security Posture | Broader DNS-based email-security posture checks (SPF / DMARC / DKIM / MTA-STS / TLS-RPT / CAA / DNSSEC). |
Why this grouping exists
Findings are grouped by the detection sources they come from. This queue collects web-application header/config weaknesses plus DNS/email-authentication posture — the latter grouped here because it has no dedicated module of its own — while exposed ports and services, SSL/TLS, and cloud storage are scoped to their own modules so nothing is double-counted. The same underlying alert can appear in Alerts (the union of everything) and here (this scoped slice) — it is one record, surfaced in two views, not a duplicate.
Two status axes, never conflated
Every finding has two separate states, and the product keeps them apart:
- Scanner status — what ShadowMap's scanners currently observe:
New(just discovered),Open(still detected in the latest scan),Reopened(detected again after a previous close), orClosed(no longer detected). This is machine-driven; you do not set it. - Analyst response — what your team decided:
Needs Review(the default until someone triages it),Investigating,Accepted Risk, orClosed. This is the workflow axis you control.
The word "Closed" exists on both axes and means different things. A scanner-Closed finding is simply gone from the latest scan — the header was added, the path was removed, the origin was firewalled. An analyst-closed finding is one a human dispositioned. A finding can be scanner-Open and analyst-Accepted Risk at the same time (the weakness is real and ongoing, but you have decided to live with it), or scanner-Closed and still awaiting review (the scanner no longer sees it, but nobody confirmed the fix). Keeping the axes separate is what lets you tell those apart.
Risk levels
Risk is derived from each finding's numeric risk score (0–10). The thresholds are:
| Risk | Score | Meaning |
|---|---|---|
| High | 8 – 10 | Critical exposure; act immediately |
| Medium | 5 – 7 | Significant risk; address promptly |
| Low | 2 – 4 | Minor risk; address when convenient |
| Informational | 0 – 1 | Awareness only; no immediate action |
By default the list sorts by Created (newest first). You can re-sort by Risk to push the highest-severity weaknesses to the top.
Deduplication and auto-reopen
ShadowMap collapses repeat detections of the same weakness into one finding. The identity is a hash of the finding's join keys — IP, host, port, path, source, and title. When a later scan re-detects the same weakness on the same app, ShadowMap updates the existing record (refreshing its last-detected timestamp) instead of creating a second row.
If a finding was previously closed and the same weakness resurfaces in a new scan, it is reopened — the scanner status flips back to detected. A reopened app misconfiguration almost always means the remediation was incomplete or the issue recurred (a header was dropped again in a redeploy, a risky app response returned, or an SPF/DMARC record regressed). This is why the queue stays trustworthy over time: a clean list means the weaknesses are genuinely gone, not just stale.
Understanding the data
Columns
| Column | Description |
|---|---|
| Title | The human-readable finding name, e.g. "Missing Security Header: Strict-Transport-Security" or "Login Page without Encryption". Always shown. |
| Risk | High / Medium / Low / Informational, colour-coded (see thresholds above). |
| Status | The current workflow/scanner status text for the finding. |
| Assigned To | The team or user the finding is routed to, or – if unassigned. |
| Source | Hidden by default. Intended to name the detection finding type, but the list response does not populate this cell, so it renders – when the column is shown; the finding types are listed in How it works above. |
| Created | Sortable header — the list defaults to sorting by it (newest first) — but the cell itself renders –, because the list response returns the first-seen timestamp under a different field than the cell reads. |
Columns other than Title can be shown or hidden; your selection is remembered in the browser for next time.
The affected asset
Each finding is tied to a specific application target. In the detail view you can see the host, IP, and port the weakness was found on, along with enrichment such as the hosting provider (ASN) and geolocation where available. This is what tells you which app to fix — a "Missing Security Headers" finding on payments.example.com is a very different priority from the same finding on a marketing microsite.
Filtering and search
The filter bar lets you narrow the queue by:
- Title — the specific finding name.
- Risk — High, Medium, Low, Informational.
- Status — workflow/scanner state.
- Assignee — the team or user a finding is routed to.
- Source — the detection finding type (e.g. Missing Security Headers, DMARC).
- Date — when findings were created.
The search box is a free-text match over finding fields. The Bookmarked chip toggles the list down to items you have starred; it re-queries the server so the rows and the total count both reflect just your bookmarks, without changing your structured filters.
Triage workflow
A practical first pass: sort by Risk descending and work the At Risk Applications and Missing Security Headers findings first — those are the web-application weaknesses an attacker can act on directly. The DNS/email-authentication posture findings (SPF, DKIM, DMARC, DNSSEC, DNS recursion) are usually a separate, lower-urgency workstream owned by whoever manages your DNS.
Taking action
From the list you can:
- Bookmark a finding (the star) to add it to your personal working set.
- Select rows (checkbox, or select-all in the header) for bulk operations.
- Comment on a finding inline — the comment thread on each row supports saved comment templates for consistent triage notes.
- See who owns each finding in the Assigned To column, and filter by Assignee to isolate a given team or user's slice.
- Export the current view to a file for reporting or offline work; the export respects your active filters and search.
Opening a finding (click the row) brings up its detail, where you can review the affected asset, the evidence, and the full history, and disposition it. Because app misconfigurations share the Alerts backend, the same status workflow, assignment, SLA tracking, and sharing/integration actions available in Alerts apply here.
Keyboard shortcuts
The list supports keyboard-driven triage:
| Key | Action |
|---|---|
| j / ↓ | Next row |
| k / ↑ | Previous row |
| Enter | Open the focused finding |
| Space | Toggle selection |
| s | Toggle bookmark (listed in the in-app help overlay but not currently wired on this page — use the row star instead) |
| Esc | Close the detail drawer |
| ? | Show the shortcut help overlay |
Common questions
How is this different from the main Alerts queue? It is the same data, scoped. App Misconfigurations shows only a fixed set of detection sources — at-risk applications, missing security headers, and DNS/email-authentication posture (SPF, DKIM, DMARC, DNSSEC, DNS recursion). Alerts shows the union of all finding types across every module. Use this view when you want the header/config and DNS-posture slice without network, certificate, credential, or dark-web noise.
Why does a finding I "fixed" keep coming back? Because the same weakness was detected again on a later scan, the record auto-reopens. A reopened app misconfiguration means the fix did not hold — a hardening header was lost in a redeploy, a risky app configuration returned, or a DNS/email-auth record regressed. Treat a reopen as a signal that the remediation needs to be made durable, not just applied once.
A finding shows as Closed but I never touched it. What happened? That is the scanner status, not an analyst disposition. The scanner simply no longer detects the weakness — the exposure is gone from the latest scan. It is a good outcome, but it is independent of whether your team formally reviewed and closed it.
Can I focus on the findings a given team owns? Yes. Filter by Source and Title to carve out a specific class of weakness, and by Assignee to narrow to the team or user a finding is routed to. Assignment, SLA policies, and notifications carry over from the shared Alerts backend.
Where do defacement findings live? Not in this queue — website-defacement detections are not among this module's detection sources. They have their own dedicated, full-context view: Defacements.
Related
- Alerts — the unified triage queue this module is a filtered slice of; shares the same status workflow, risk model, assignment, and export.
- Web Applications — the inventory of discovered web apps these misconfigurations are found on.
- SSL Certificates — certificate and TLS hygiene (handled as a separate finding class from app misconfigurations).
- Open Ports and Network Services — the network-layer counterparts: exposed ports and services rather than application weaknesses.
- Defacements — dedicated view for website-defacement findings.
- Technology Stack — the technologies fingerprinted on your apps, useful context when prioritising a misconfiguration.