
IP Addresses
The complete inventory of IP addresses ShadowMap attributes to your organization — discovered through domain resolution, subdomain enumeration, certificate transparency, and infrastructure mapping. Each IP is a pivot point that ties together the open ports, web applications, subdomains, SSL certificates, and alerts that live on it.
Overview
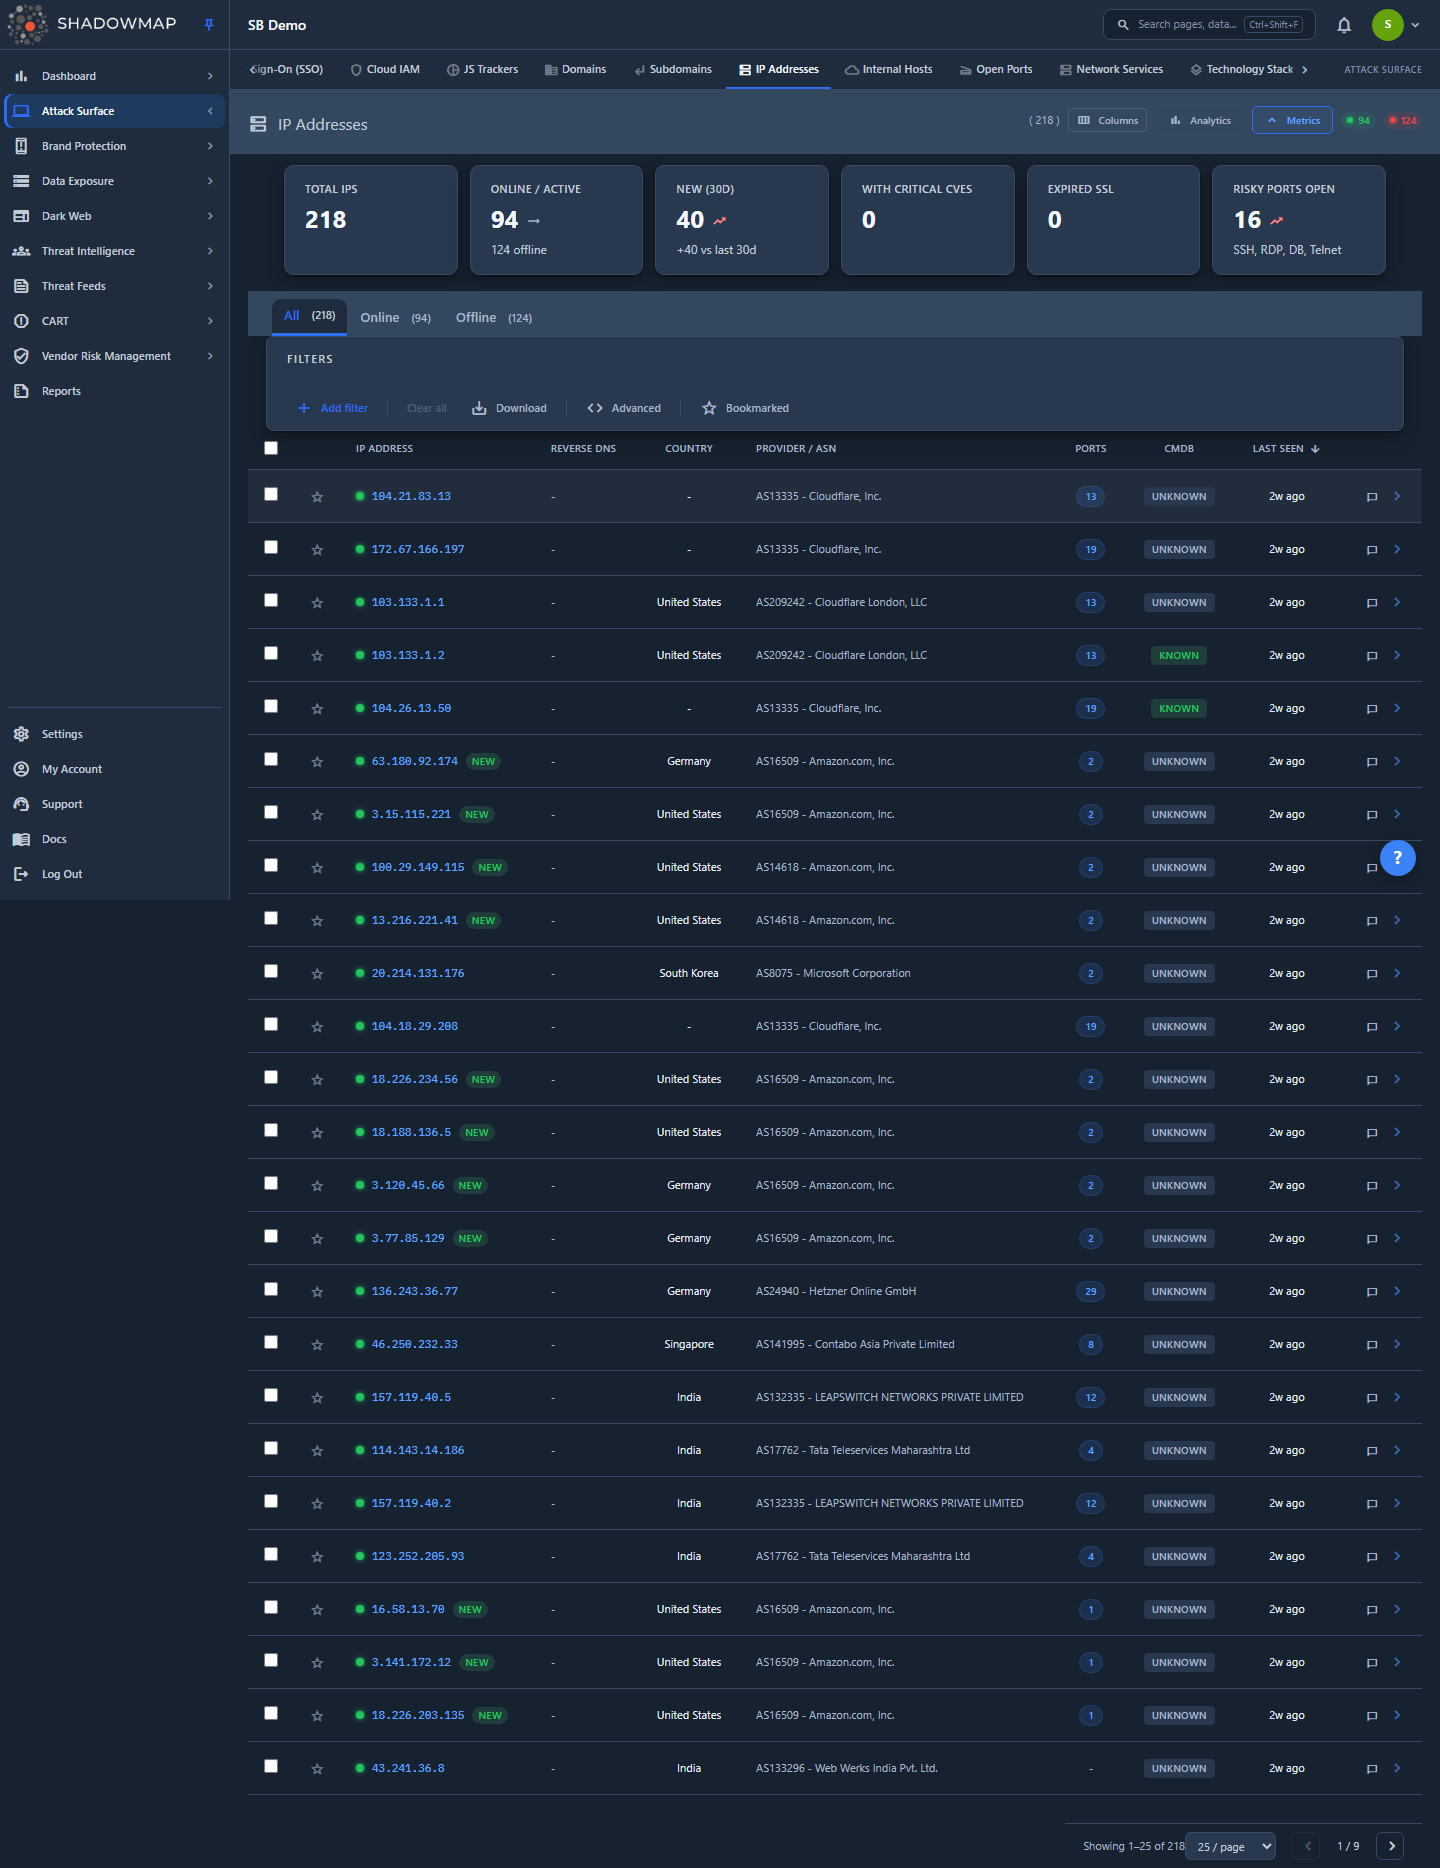
The IP Addresses view is a single sortable, filterable table of every IP attributed to you. The header shows the total count plus two live badges — a green Online count and a red Offline count — so you can immediately see how much of your attributed address space is currently responding.
Above the table you get three optional layers:
- A metrics strip (six KPI cards) — collapsed/expanded state is remembered per browser.
- An analytics panel of charts (collapsed by default) — trend, geography, providers, ports.
- Status tabs (All / Online / Offline) for one-click scoping.
Each row drills into a quick detail drawer (slide-out, no page navigation) or a full detail page with Overview, Threat Exposure, Related Assets, and Alerts tabs.
Where IPs come from
This module is read-only inventory — you do not add IPs by hand. ShadowMap populates it from its own discovery pipeline (domains, subdomains, certificates, and reverse-resolution). To influence what gets attributed to you, manage your seed domains and scan scope in Domains and the scan configuration, not here.
How it works
Most of what makes this page useful is computed server-side and is not visible from the column headers alone.
Online vs. Offline
Status is a stored integer flag on each IP record — 1 is surfaced as Online, 0 as Offline. "Online" means the address was responding (had at least one reachable service) on the most recent scan that touched it; "Offline" means it was previously attributed to you but did not respond on the last pass. Offline IPs are kept in inventory rather than deleted — a host that goes dark and comes back is a meaningful signal, and decommissioned-but-still-attributed space is itself worth reviewing. The Online/Offline header badges and the status tabs both read from this field.
The Ports count
The Ports column is a per-IP count of distinct open ports, batch-resolved from the summarized_open_ports data (joined on IP + company) in a single query for the whole page — not an N+1 lookup. A blank dash means no open ports were observed. The per-port breakdown (port, service, product, version) appears in the detail drawer, and the full list — with the service banner as well — is on the Overview tab of the detail page. To work ports across your whole estate instead of one IP at a time, use Open Ports.
CMDB status (Known / Unknown)
The CMDB badge tells you whether an IP is reconciled against your configuration management database:
- Known — at least one application hosted on this IP has a
matchedrecord in CMDB reconciliation. - Unknown — no matched application is associated with the IP (the default, and the common case when CMDB reconciliation is not configured).
"Unknown" is styled neutrally, not as a warning, precisely because it is the default state when no CMDB feed is present. Where CMDB is configured, an Unknown IP carrying live services is exactly what shadow-IT hunting looks for. The reconciliation itself is driven by CMDB Reconciliation.
The "NEW" badge
An IP that was first seen within the last 30 days carries a NEW badge next to its address in the IP Address column. The flag is keyed on the record's first-seen date (created_at) only — it is never triggered by an Offline→Online status flip — so it marks genuinely newly-attributed address space, not a host coming back online. The list has no dedicated First Seen column (that value lives in the detail drawer), so the badge is how new infrastructure surfaces in the table. It is the per-row counterpart to the New (30d) metric card.
Reverse DNS de-duplication
When a reverse DNS (PTR) lookup fails, the backend sometimes returns the IP itself as the reverse_dns value. The table detects this and renders a dash instead of printing the same address twice, so a - in the Reverse DNS column means "no usable PTR record," not "empty field."
Threat exposure correlation (detail page)
The Threat Exposure tab does live correlation rather than reading a stored value. For the selected IP it: (1) collects the technology stack detected on that IP's applications and ports, (2) lower-cases the product names and matches them against the central CVE database (cve_affected_vendors → cves, with CVSS pulled from cve_metrics), and (3) for the top CVEs, looks up associated threat actors through MISP event mappings. The summary cards (Technologies, Matching CVEs, Critical CVEs, Exploited/KEV, Threat Actors) are counts off that correlation. Because it is product-name-based, this is an exposure view — "you run software with known CVEs," not "this CVE is confirmed exploitable here." Confirmed, scanner-validated findings live in Alerts and Vulnerability Overview.
Understanding the data
Columns
The table is column-customizable (gear/customizer in the header). IP Address is locked on; the rest can be toggled and your selection is saved in the browser.
| Column | Description |
|---|---|
| IP Address | The address, mono-spaced, with a colored status dot (green = Online, red = Offline). IPs first seen in the last 30 days also carry a NEW badge here (see How it works). Click to open the detail drawer. |
| Reverse DNS | PTR record for the IP, or - if none usable (see above). |
| Country | Geolocated country for the IP. |
| Provider / ASN | Hosting provider / autonomous system the IP belongs to (e.g. cloud provider, ISP, datacenter). |
| Ports | Count of distinct open ports observed on the IP. Blank dash = none. |
| CMDB | Known / Unknown / - — CMDB reconciliation status (see How it works). |
| Last Seen | Relative time since the IP was last observed responding. |
Metrics strip
Six KPI cards summarize your IP posture at a glance:
| Card | What it counts |
|---|---|
| Total IPs | All IPs attributed to you. |
| Online / Active | IPs currently responding; subtitle shows the offline count. Clickable — filters to Online. |
| New (30d) | IPs first discovered in the last 30 days, with a +/- comparison against the prior 30 days. An upward trend is flagged as the "bad" direction (growing attack surface). |
| With Critical CVEs | Intended to count IPs whose tech stack matches a Critical-severity CVE, but the summary backend currently hard-codes this card to 0 (the CVE correlation is not wired into the metrics endpoint), so it always reads 0. |
| Expired SSL | Intended to count IPs serving an expired certificate, but the summary backend currently hard-codes this card to 0 (the IP-to-certificate join is not yet implemented), so it always reads 0. |
| Risky Ports Open | IPs exposing a high-risk service port (see below). |
Risky ports
The "Risky Ports Open" metric counts IPs exposing any of these ports: 22 (SSH), 23 (Telnet), 3389 (RDP), 445 (SMB), 1433 (MSSQL), 3306 (MySQL), 5432 (PostgreSQL), 27017 (MongoDB), 6379 (Redis), 11211 (Memcached) — remote-access and database services that should rarely be internet-facing.
Analytics panel
Collapsed by default. Expand it for visual distribution analysis:
- IP Discovery Trend (30 Days) — new IPs discovered per day, for spotting sudden infrastructure growth.
- Geographic Distribution — IP count by country (top 10).
- Provider / ASN Breakdown — IP count by hosting provider (top 10), useful for finding infrastructure outside your sanctioned cloud accounts.
- Top Exposed Ports — most common open ports across your IPs, labeled with their service.
- Status Distribution — Online vs. Offline split.
Filtering & search
The filter bar supports field-based filters on:
| Field | Notes |
|---|---|
| Status | Online / Offline (mirrors the status tabs). |
| IP Address | Match a specific address or pattern. |
| Country | Geolocated country. |
| Reverse DNS | PTR record value. |
| City | Geolocated city. |
| Provider | Hosting provider / ASN. |
Additional controls:
- Status tabs (All / Online / Offline) — fastest way to scope by reachability; they apply a
statusfilter under the hood. - Bookmarked toggle (star) — show only IPs you've bookmarked.
- Sorting — click any sortable column header (IP Address, Reverse DNS, Country, Provider/ASN, Last Seen). The Ports and CMDB columns are not sortable. Default sort is Last Seen, descending.
- Pagination — 25 / 50 / 100 / 200 rows per page.
- Universal search — the IP module is wired into global search; see Universal Search.
Filters carry into pivots
Filters live in the URL query, so a filtered IP view can be bookmarked or shared as a link. The Related Assets chips in the detail drawer (below) pass the IP forward as a filter to other modules, so you stay in context as you pivot.
Detail drawer
Clicking an IP row (or pressing Enter on a focused row) opens a 560px slide-out drawer without leaving the list. It shows:
- IP, status badge, and reverse DNS.
- Infrastructure grid — Country, City, Provider/ASN, First Seen, Last Seen.
- Related Assets chips — counts for Ports, Apps, Subdomains, SSL Certs, and Alerts. The Ports, Apps, Subdomains, and Alerts chips are clickable and pivot to the corresponding module pre-filtered to this IP (Open Ports, Web Applications, Subdomains, and Alerts respectively).
- Open Ports — top 10 ports with service/product/version.
Use the left/right (previous/next) arrows in the drawer header to step through IPs without closing it, or Open full page to jump to the complete detail view.
Detail page
The full detail page (chevron on a row, or "Open full page" from the drawer) has four tabs:
| Tab | Contents |
|---|---|
| Overview | Open ports (port, service, product, version, banner) and SSL certificates on the IP, each with a Valid / Expiring Soon / Expired status derived from the certificate's expiry date. |
| Threat Exposure | Detected technologies, matching CVEs (with CVSS, severity, KEV flag, and linked threat actors), and related threat actors — all from the live correlation described in How it works. |
| Related Assets | Applications tied to the IP (host, port, protocol, risk, status, last seen) each with a View link to the full application, and subdomains resolving to the IP (status, country, last seen). |
| Alerts | Security alerts associated with the IP, with a High/Medium/Low/Info summary. |
The header card also shows the CMDB Known/Unknown badge and a Related Assets summary (Ports, Apps, Subdomains, SSL Certs, Alerts).
Taking action
| Action | Where | What it does |
|---|---|---|
| Bookmark | Star icon on a row | Flag an IP for follow-up; filter the list to bookmarked-only with the Bookmarked toggle. |
| Comment | Comment icon on a row | Add notes to an IP; comment templates from your workspace settings are available. |
| Assign | Bulk action bar | Select rows, then Assign to a team member (or Clear assignee) for triage ownership. |
| Export | Header / bulk action bar | Export the current (filtered) IP list to Excel. The export respects active filters. |
| Share | Bulk action bar | Share selected IPs via the sharing/integrations workflow. |
| Pivot | Detail drawer chips | Jump to Open Ports, Web Applications, Subdomains, or Alerts pre-filtered to the IP. |
Keyboard triage
The list supports keyboard-driven review: j / ↓ next row, k / ↑ previous row, Space toggle selection, Enter open the detail drawer, Esc close it, and ? to show the shortcut help overlay.
Common questions
An IP shows as Offline — should I remove it? Not automatically. Offline means it didn't respond on the last scan, but it stays in inventory because attributed-but-dark space is a legitimate review item (decommissioned hosts that still resolve, infrastructure that intermittently responds, or rotating cloud IPs). Investigate before assuming it's gone.
Why does an IP say "CMDB Unknown" when I know it's a real server? "Unknown" means no application on that IP is matched in CMDB reconciliation — most often because CMDB reconciliation isn't configured, or the application/host hasn't been reconciled yet. It is the default neutral state, not an error. See CMDB Reconciliation.
The Reverse DNS column shows a dash. Is the lookup broken? No — a - means there is no usable PTR record. To avoid printing the address twice, the table renders a dash whenever reverse DNS is empty or equal to the IP itself.
What's the difference between the Threat Exposure tab and Alerts? Threat Exposure is potential exposure derived from product-name CVE matching ("you run software X, which has these CVEs"). It is broad and not validated against the specific deployment. Alerts and Vulnerability Overview are scanner-confirmed findings. Treat Threat Exposure as a prioritization input, then confirm in Alerts.
Can I add an IP manually? No. IPs are populated by ShadowMap's discovery pipeline. To change what's attributed to you, adjust your seed domains and scan scope (start from Domains).
Related
- Domains — the seed assets that drive IP attribution.
- Subdomains — hostnames that resolve to these IPs; the IP detail drawer pivots here.
- Internal Hosts — internal/private-range hosts, the counterpart to public IP inventory.
- Open Ports — work the port/service footprint across all IPs; the Ports column and drawer chip link here.
- Web Applications — applications hosted on these IPs; the Apps drawer chip pivots here.
- SSL Certificates — certificate inventory shown on the IP Overview tab.
- CMDB Reconciliation — drives the Known/Unknown CMDB badge.
- Alerts — scanner-confirmed findings; the Alerts tab and drawer chip pivot here.
- Vulnerability Overview — validated vulnerabilities, the confirmed counterpart to Threat Exposure.