
Threats
The Threats module is ShadowMap's triage and remediation layer. Every confirmed weakness the platform finds across your external attack surface — an exposed service, a misconfigured app, a defaced page, a vulnerable host — lands here as an alert that an analyst can prioritise, assign, investigate, and close. It is the queue your security team actually works.
Overview
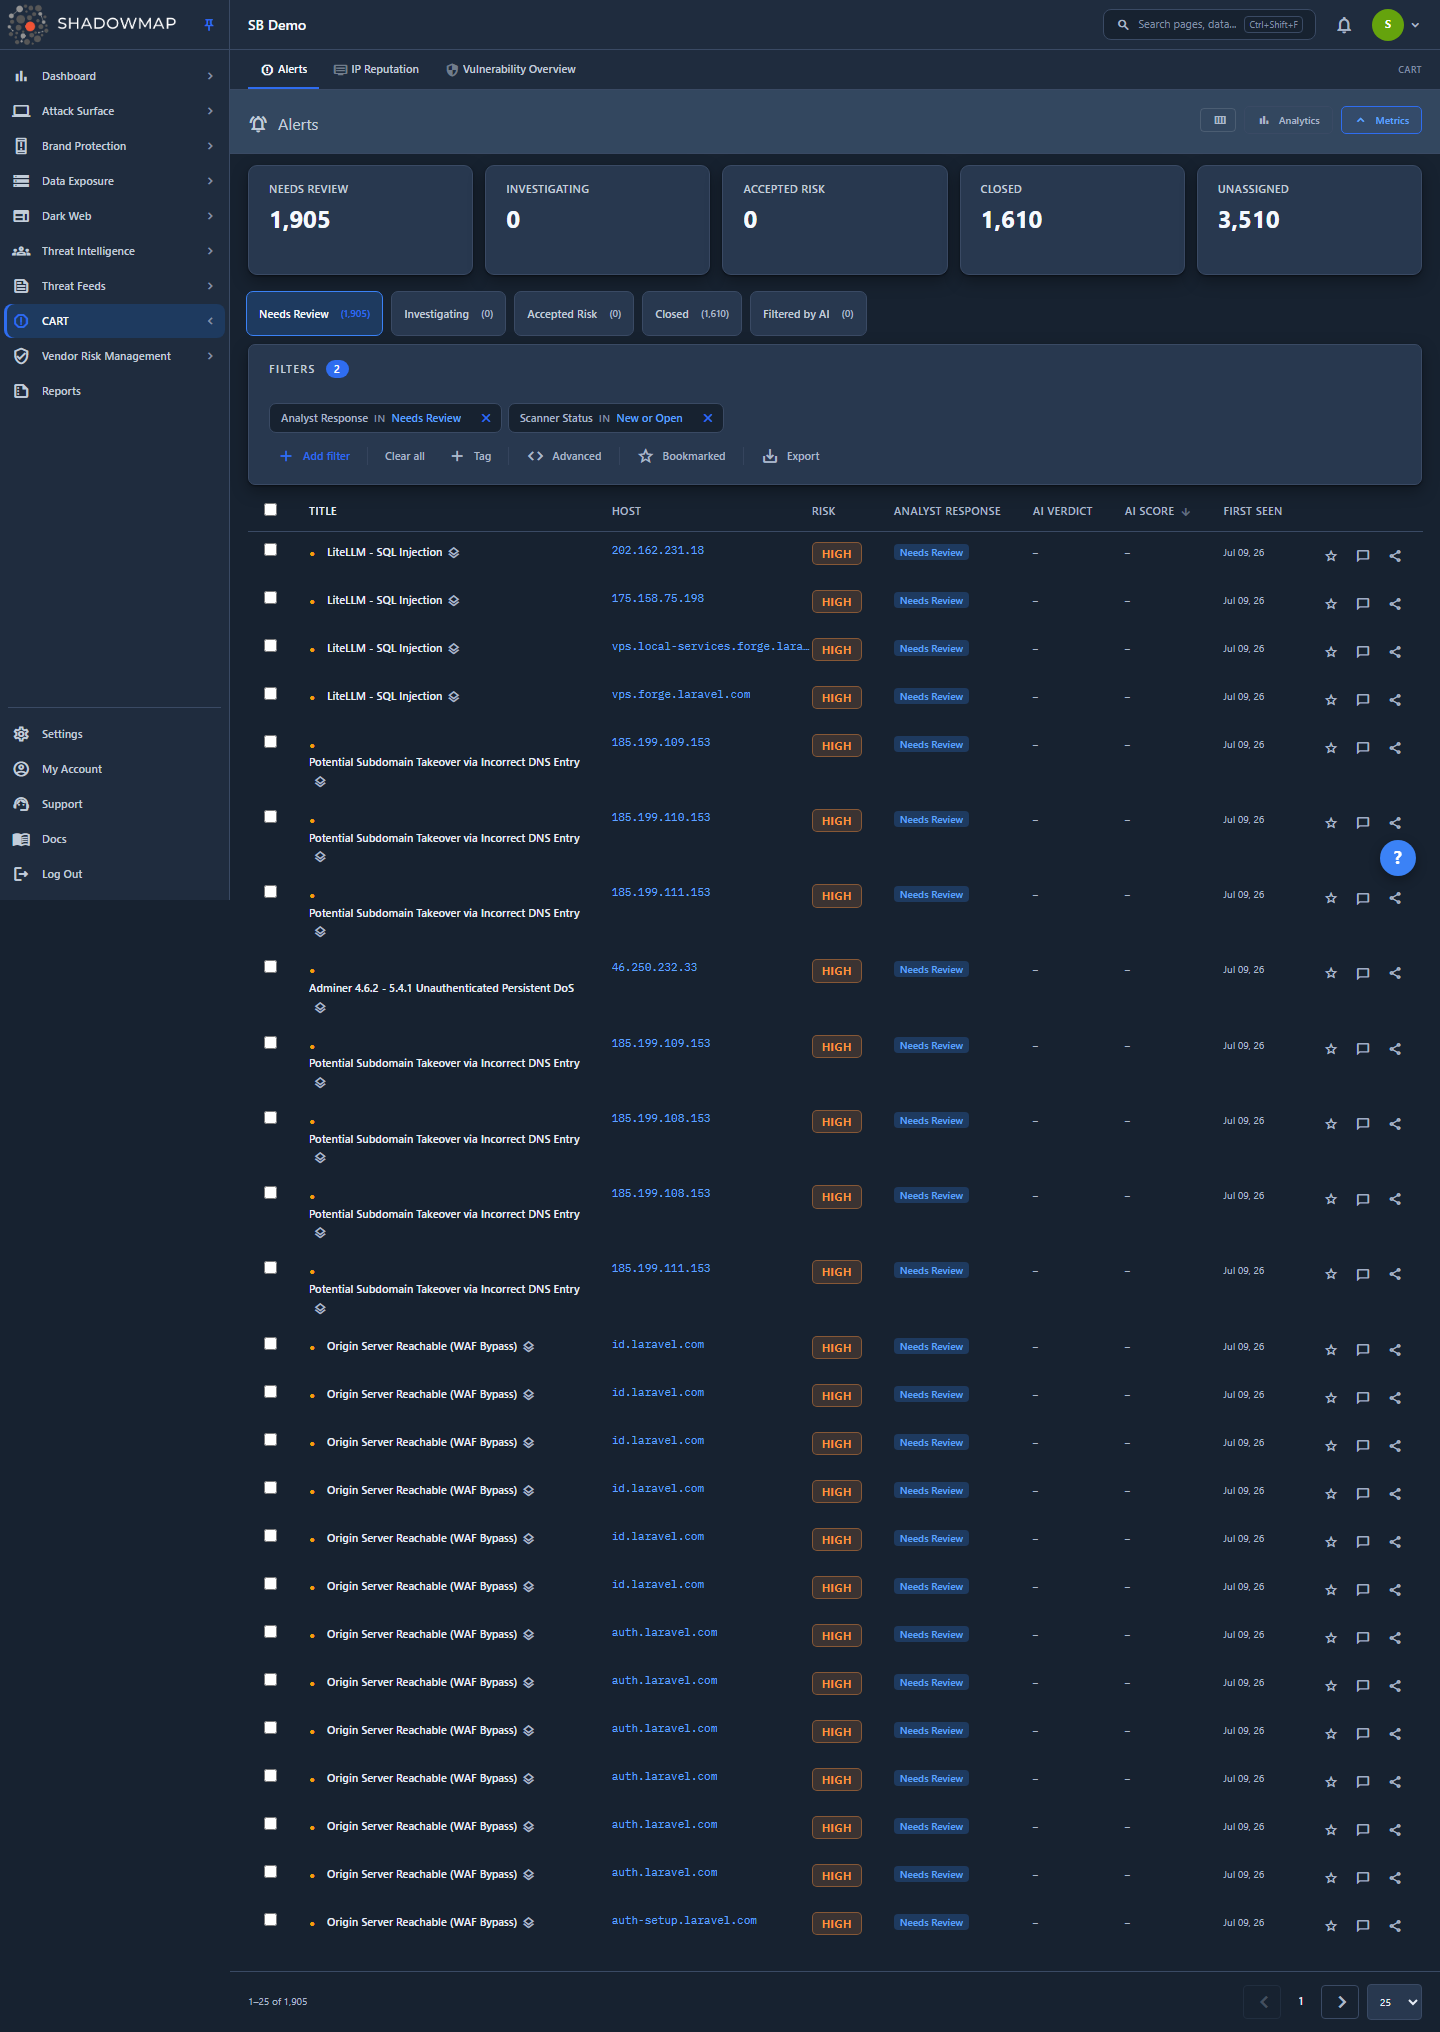
Navigating to Threats drops you on the Alerts list at the Needs Review tab (/threats/alerts/needs_review). This is the default landing surface because it answers the first operational question: what needs my attention right now?
The page is table-first. From top to bottom you see:
- A metrics strip of five KPI cards (Needs Review, Investigating, Accepted Risk, Closed, Unassigned). The first four are clickable and jump you to the matching tab; Unassigned is a read-only count.
- A collapsible analytics panel with trend and breakdown charts.
- A row of disposition tabs (Needs Review, Investigating, Accepted Risk, Closed) with live counts. On AI-enabled tenants a Filtered by AI tab appears at the end.
- A filter bar with a Bookmarked toggle and Export action.
- The alerts table, where each row opens a detail drawer.
The Threats module groups several related finding surfaces under one route. The primary one is Alerts (the consolidated triage queue). Alongside it sit IP Reputation, Vulnerability Overview, Open Ports, Network Services, Technology Stack, App Misconfigurations, and Defacements — each a focused view of one finding class. In the sidebar these are split for convenience: Alerts, IP Reputation, and Vulnerability Overview appear under CART (Continuous Automated Red-Teaming), while Open Ports, Network Services, and Technology Stack live under Attack Surface. They all share the same alert and disposition mechanics described below.
This page documents the Alerts queue
Because /threats redirects to the Alerts list, the rest of this page covers Alerts — the default view and the model that every other Threats surface follows. Each sub-module has its own page (see Related).
How it works
The Threats queue runs on a model you cannot infer from the table alone: two independent status axes, a numeric risk score, and SLA-driven prioritisation. Understanding these is the difference between drowning in the queue and working it efficiently.
Two status axes: Scanner Status vs Analyst Response
Every alert carries two states that mean entirely different things. Conflating them is the single most common mistake new users make.
| Axis | Owned by | Question it answers | Values |
|---|---|---|---|
| Scanner Status | The platform's scanners | Is this still observable on your surface? | New, Open, Closed |
| Analyst Response | Your team | What have we decided to do about it? | Needs Review, Investigating, Accepted Risk, Closed |
- Scanner Status is automatic.
New/Openmean the finding was present in the most recent scan;Closedmeans the scanner no longer detects it (the port was firewalled, the page was fixed, the host went offline). You never set this — the scanner does. - Analyst Response is your disposition. It only changes when a human (or an automation rule) acts on the alert.
Crucially, the word "Closed" means different things on each axis. A scanner-closed alert is one that vanished from your surface; an analyst-closed alert is one your team explicitly dispositioned. The two are independent — an alert can be analyst-closed while the scanner still detects it (you accepted it as expected), or scanner-closed while still in Needs Review (it disappeared before anyone triaged it).
To keep the axes from colliding visually, the Scanner Status column is hidden by default. Instead, each row shows a small dot next to the title:
| Indicator | Meaning |
|---|---|
| ● (filled) | Currently Detected — present in the latest scan |
| ○ (hollow) | Not Detected in Latest Scan — the scanner no longer sees it |
The disposition tabs and the KPI strip both track the Analyst Response axis, so a green "Closed" card always reflects work your team did — not findings that merely disappeared.
Why the Closed tab can show more than you closed
The Closed tab is a deliberate union: it shows alerts that are analyst-closed OR scanner-closed (no longer detected). This is intentional — a finding that resolved itself is, operationally, also closed. The count on the tab matches what the list shows.
Risk score and severity
Each alert carries a numeric risk score. The platform maps it to a severity label using fixed thresholds:
| Score | Severity |
|---|---|
| ≥ 8 | High |
| ≥ 5 | Medium |
| ≥ 2 | Low |
| < 2 | Informational |
Severity is the default sort on most tabs: opening the queue puts the highest-risk alerts at the top. (On AI-enabled tenants the Needs Review tab defaults to AI Score instead — see AI review below.) For vulnerability-backed alerts you can also filter on the CVE exploit-prediction score (EPSS) as a separate field — see Filtering and search.
AI review (advisory)
On tenants with AI review enabled, ShadowMap layers an advisory machine assessment over the queue. It adds three columns — AI Verdict (a labelled assessment badge), AI Score (a 0–1000 confidence value, sortable), and AI Tags (controlled-vocabulary labels) — and two matching filter fields, AI Assessment and AI Tags. The assessment is advisory: it informs triage but never overrides a disposition your team sets.
Two behaviours follow from it:
- A "Filtered by AI" tab and response. Alerts the model judged benign are moved to a dedicated
Filtered by AIanalyst response and surface under a Filtered by AI tab. This is set by automation, not by an analyst, and it keeps low-signal findings out of Needs Review without closing them. - AI-aware default sort. On the Needs Review tab, AI-enabled tenants default to sorting by AI Score (highest concern first) rather than Risk. Every other tab, and every tenant without AI review, still defaults to Risk. Any sort you choose yourself always wins.
If your tenant does not have AI review, none of these columns, filter fields, tabs, or sort behaviours appear.
SLA-driven prioritisation
Alerts are governed by SLA policies (the queue's SLA type is ALERT). A policy can require, for example, that any High-risk alert be acted on within a set number of days. When an alert breaches its policy it surfaces as an SLA Policy Violation, which you can filter on. This is how the queue distinguishes "important" from "overdue" — and it feeds the platform's SLA-violation reporting.
How findings become alerts
The scanners that feed Threats run on a continuous cadence. When a scan confirms a weakness, it creates (or re-opens) an alert with New/Open scanner status and Needs Review analyst response. On subsequent scans:
- If the finding is still present, the alert stays
Open. - If it disappears, the scanner flips the alert to
Closed(and stamps the last-detected time). - If a previously-resolved finding reappears, the alert re-opens — you do not get a duplicate.
The customer-facing taxonomy for what kind of finding an alert is comes from the Finding Type field (filterable). ShadowMap deliberately does not expose the underlying third-party scanner names; Finding Type is the stable, vendor-neutral classification you filter and report on.
Understanding the data
Columns
The table is column-customisable (the Title column is locked on). The default view is a lean triage set — Title, Host, Risk, Analyst Response, First Seen (plus AI Verdict and AI Score on AI-enabled tenants) — and everything else is opt-in through the column customiser. Defaults are marked below.
| Column | Default | Description |
|---|---|---|
| Title | Yes (locked) | The alert headline, prefixed with the ●/○ scanner-detection dot. A layers icon beside the title jumps to the Vulnerability Overview rollup for that finding. |
| Host | Yes | The affected hostname or bare IP. Links into Subdomains (or IP Addresses if the host is an IP). |
| IP | No | The resolved IP. Links into IP Addresses. |
| Port | No | The affected port. Links into Open Ports, scoped to that IP and port. |
| Path | No | The URL path the finding was observed on, where applicable. |
| Risk | Yes | Severity badge (High / Medium / Low / Informational). |
| Scanner Status | No | New / Open / Closed. Hidden by default in favour of the title dot. |
| Analyst Response | Yes | Needs Review / Investigating / Accepted Risk / Closed / Filtered by AI. |
| AI Verdict | Yes* | Advisory AI assessment badge. AI-enabled tenants only. |
| AI Score | Yes* | Advisory AI confidence score (0–1000), sortable. AI-enabled tenants only. |
| AI Tags | No* | Controlled-vocabulary AI labels. AI-enabled tenants only. |
| Custom Tags | No | Key:value tag pills applied manually or by tag rules. |
| Assigned To | No | The owning analyst, shown as initials. |
| First Seen | Yes | When the alert was first raised (relative time). |
| Last Detected | No | When the scanner last observed the finding (relative time). |
| Last Commented | No | When the alert was last commented on. |
| Dispositioned At | No | When the alert last received an analyst response. |
* The three AI columns exist only on tenants with AI review enabled; AI Verdict and AI Score are default-visible there, AI Tags is opt-in. On tenants without AI review they do not appear at all.
The host, IP, and port cells are pivot links — they carry you straight into the relevant asset surface filtered to that exact value, so you can see everything else known about the affected asset without re-searching.
Analyst Response values
| Response | Meaning |
|---|---|
| Needs Review | Untriaged. The default state of every new alert. |
| Investigating | A human is actively working it. |
| Accepted Risk | Reviewed and consciously accepted (e.g. expected exposure, compensating control in place). |
| Closed | Dispositioned and done — remediated, false positive, or otherwise resolved. |
| Filtered by AI | Set automatically by AI review for findings judged benign — keeps low-signal alerts out of Needs Review without closing them. Not analyst-settable; appears only on AI-enabled tenants. |
Filtering and search
The filter bar supports a rich, field-level query builder. Available filter fields:
| Field | Notes |
|---|---|
| Alert Title, Host, IP Address, Port, Path | Asset and finding identifiers. |
| CVE ID, CWE ID | Tie alerts to specific vulnerabilities or weakness classes. |
| Risk | High / Medium / Low / Informational. |
| Scanner Status | New / Open / Closed (the automatic axis). |
| Analyst Response | The disposition axis. |
| Assigned To | Filter by owning analyst. |
| Country, ASN | Geo / network ownership of the affected IP. |
| Finding Type | The vendor-neutral finding taxonomy. |
| Tag Rule | Alerts matched by a given tag rule. |
| SLA Policy Violation | Alerts that have breached their SLA. |
| EPSS Score | CVE exploit-prediction score, for vulnerability-backed alerts. |
| Bookmarked | Limit to bookmarked alerts. |
| First Seen, Last Detected, Last Commented, Dispositioned At | Date ranges. |
Each disposition tab pre-applies a filter preset (for example, Needs Review = analyst response needs_review and scanner status new/open). You can layer additional filters on top, and the filter bar always shows exactly what the active tab is querying. The Bookmarked star toggle is a one-click shortcut to your starred alerts.
Save the views you run daily
A filter combination you return to — say, "High-risk SLA violations, unassigned" — can be saved. See Saved Searches.
Detail view
Clicking a row opens a side drawer; the expand icon opens the full alert page. The drawer is built for fast, keyboard-driven triage.
Header / navigation
- Previous / Next chevrons step through the current result set (keyboard:
k/j). They disable at the first and last alert.Esccloses the drawer. - An "open full page" icon takes you to the standalone alert view.
Top panel shows the three states side by side — Risk, Scanner Status, Analyst Response — followed by a row of disposition action buttons.
Summary tab lists the core fields: Scanner Status, Analyst Response, Host, IP, Port, First Seen, Last Detected, Assigned To.
Context tab surfaces the supporting evidence:
- Tags and Custom Tags applied to the alert.
- An Evidence Snapshot — a structured classification of why the finding fired.
- A proof-of-concept screenshot where the scanner captured one.
- The raw Evidence the finding was based on (for example the request/response or command output), shown inline where the scanner captured it — previously visible only on the full alert page.
Taking action
You can disposition alerts one at a time from the drawer, or in bulk from the list.
Per-alert (drawer):
- Set Analyst Response: Needs Review, Investigating, Accept Risk, or Close.
- Share the alert (to a connected integration).
- Add comments and bookmarks from the row.
Bulk (selection bar): select alerts via the row checkboxes (or the header "select all on page") and a bulk action bar appears, letting you:
- Change status for all selected alerts.
- Assign them to an analyst.
- Bookmark them.
- Share them.
- Apply a custom tag value.
Selection resets when you change pages
Bulk selection is scoped to the current page. Moving to another page, changing the page size, or paging the drawer clears your selection — this is deliberate, so a bulk action can never silently hit alerts you can't see. Select and act page by page.
Export: the Export button generates a download of the alerts matching your current filter, sort, and search — not just the visible page. See Exports.
Common questions
Why does an alert say "Closed" but still show a filled ● dot? Those are the two different axes. The badge or tab is the Analyst Response (your team closed it). The filled dot is the Scanner Status — the scanner still detects it on your surface. That combination usually means you accepted or closed a finding that is genuinely still present (expected exposure, or remediation in progress).
An alert disappeared from Needs Review on its own — what happened? The scanner stopped detecting it, so its scanner status flipped to Closed and it dropped out of the open tabs into the Closed tab (the union). The underlying weakness was fixed, the asset went offline, or the exposure was otherwise removed. It was never deleted — you can find it under the Closed tab, which unions analyst-closed and scanner-closed alerts.
What's the difference between "Accepted Risk" and "Closed"? Accepted Risk is an explicit decision to live with a finding that remains valid (compensating control, business exception). Closed means the issue is resolved or not actionable. Both remove the alert from your active Needs Review queue, but Accepted Risk signals an ongoing, knowingly-tolerated exposure.
Where do alerts come from? From ShadowMap's continuous external scans — open ports, network services, application misconfigurations, web defacements, vulnerable technology, IP reputation hits, and more. Each of those finding classes has its own focused view, but they all roll up into the Alerts queue here.
Why can't I see the name of the scanner that found it? By design. ShadowMap normalises findings into a vendor-neutral Finding Type taxonomy so your reporting and filtering stay stable regardless of the underlying tooling. Filter and report on Finding Type instead.
How do I make sure the right things bubble up? Sort by Risk (the default), filter on SLA Policy Violation to surface overdue items, and use tag rules and SLA policies to automate prioritisation and routing.
Related
- Alerts — the full reference for the alert queue this page summarises.
- IP Reputation — alerts for IPs flagged on threat-intelligence reputation feeds.
- Vulnerability Overview — CVE-centric view of your vulnerable assets.
- Open Ports — every exposed port; alert rows pivot here by IP and port.
- Network Services — services running behind those ports.
- Technology Stack — detected software and its known vulnerabilities.
- App Misconfigurations — application-layer configuration weaknesses.
- Defacements — detected web defacements.
- SLA Policies — define the timeframes that turn alerts into SLA violations.
- Severity & Status — how severity and status work across the platform.
- Status Workflow — the canonical disposition lifecycle.