
Data Leaks Overview
The landing page for the Data Leaks module (its header reads Data Exposure, the internal name). It rolls up every place ShadowMap found your data sitting where it should not be — exposed credentials, public code repositories, leaked documents, container registries, exposed APIs, open S3 buckets, and shortened URLs — into one metrics strip, a cross-module health matrix, program-impact and per-module lifecycle views, a severity distribution, a CISO/analyst summary, and a live feed of the most recent finds.
Overview
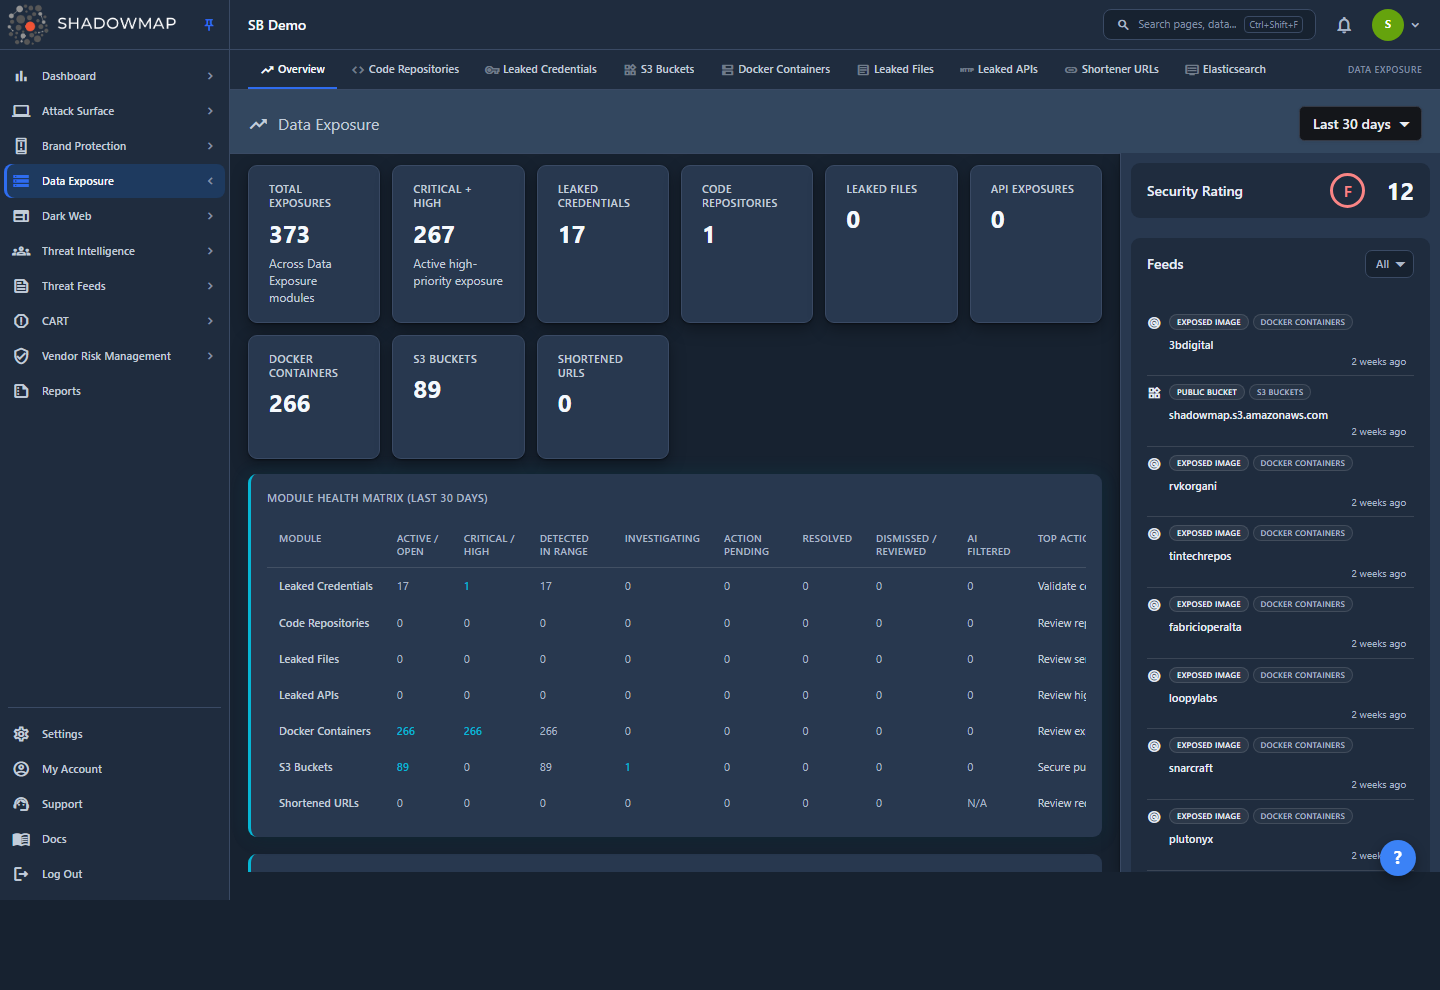
The page is built for a quick triage read: glance at the metrics strip to see where your exposure is concentrated, scan the Module Health Matrix for the module and lifecycle stage carrying the most work, read the Severity Distribution to find the modules holding Critical/High findings, and use the feed sidebar to see what came in most recently. Every number, tile, and badge is a link into the underlying module list, so the overview is meant to be a jumping-off point rather than a place you work.
The header carries a single control: a time-range selector (top right) with presets Last 7 days, Last 30 days, Last 90 days, Last 6 months, Last 1 year, and All time. It defaults to Last 30 days, and your choice is remembered in the browser per module (it persists across page loads). Changing the range reloads every card and resets the feed. The Module Impact Graphs card also carries an inline row of the same presets (7D / 30D / 3M / 6M / 1Y / All) that drives the one shared selector.
The page is gated by the Data Leaks Overview read permission. If you cannot see it, ask an admin to grant that permission to your role (see Roles & Permissions).
How it works
The mechanics below are not visible in the UI but determine what every number means.
What counts as a "leak"
The overview aggregates seven independent sources, each with its own scanner, parser, and detail page. They are not the same kind of finding — a code repository hit is very different from an open S3 bucket — but the overview treats each as one row of "exposure" for counting purposes:
| Module | What it finds |
|---|---|
| Code Repositories | Public GitHub/GitLab/Bitbucket repos containing your code, secrets, or internal references |
| Leaked Credentials | Exposed usernames, passwords, and keys attributed to your org (including validated working secrets) |
| Leaked Files | Documents exposed on file-sharing and sandbox services (e.g. Scribd, malware sandboxes) that reference your org |
| Leaked APIs | API endpoints exposed in public sources, grouped by the subdomain they belong to |
| Docker Containers | Public container registry images that reference or belong to your org, scanned layer-by-layer for secrets |
| S3 Buckets | Publicly readable cloud storage buckets attributable to your org |
| URL Shorteners | Shortened links (bit.ly and similar) that resolve to your assets or expose internal/credential-bearing URLs |
The Total Exposures metric is simply the sum of the seven module counts for the selected time range — it is a convenience roll-up, not a deduplicated count of unique incidents. A single underlying exposure (for example, a credential found both in a repo and a container) is counted once per module it appears in. Leaked Credentials was added to this roll-up so the most security-critical module is no longer excluded from the totals.
The time range filters by discovery date, not severity
The range selector maps to a "first seen" / discovery cut-off on the backend. "Last 30 days" means findings discovered in the last 30 days, and "All time" removes the cut-off entirely (it resolves to an unbounded window, so it shows your complete historical exposure). This is why switching to a shorter range can drop the counts to zero on a tenant whose exposure is older — the data is still there, it was just discovered before the window. Use All time to see your full standing exposure and the shorter windows to see what is new.
Counts on this page can differ from the module list pages by design
Some cards apply a stricter scope than a naive "count everything" query, and two modules are counted for their whole history rather than the selected window, so the overview reconciles with the visible state of each module rather than its raw row count:
- Code Repositories counts only the canonical visible scope (online and not dismissed), the same population the module's severity view uses. This count is lifetime — it deliberately ignores the time-range selector, because a repo that leaked before the window is still a live exposure. It also does not count dismissed or offline repositories, so the overview total matches what you actually see when you open the module.
- Leaked Credentials is likewise counted as a lifetime module total (it has no windowed count yet), so it does not drop to zero on a short range.
- The other five modules (Files, APIs, Docker, S3, URL Shorteners) window by discovery date as described above.
- The Severity Distribution card is scoped to the visible/online findings per module.
When you click a severity badge, the overview sends you to the module's All tab (for code repositories and Docker) or the module's online tab (for APIs and shortened URLs), pre-filtered to the clicked risk band. Because "All" is a superset of the visible scope, the destination list may show a handful more rows than the badge counted (a few offline or dismissed items). This is intentional — it guarantees nothing the badge counted is missing from the list, at the cost of occasionally showing slightly more.
Severity drill-downs preserve each module's native risk format
Each module stores and filters its risk value differently — S3 Buckets use an integer band (0–5), Docker Containers and URL Shorteners use lowercase strings, Leaked APIs use Title-Case strings, and Code Repositories filter by a lowercase band label. The overview passes the clicked value through unchanged so the destination list filters correctly. You do not need to know any of this; just click the badge.
The feed is live, multi-source, and paginated per module
The Feeds sidebar interleaves the most recent finds across the six feed-eligible modules — Code Repositories, S3 Buckets, Docker Containers, Leaked Files, Leaked APIs, and URL Shorteners (Leaked Credentials is not in the feed) — into one stream, filling a page of 12 items. Rather than draining one source before the next, it promotes the single newest row from each module first, then backfills the remaining slots by global recency, so the top of the rail is cross-module and time-ordered and no source starves another. Each entry is a clickable link straight to that finding's detail view. Scrolling the feed loads more, tracking a separate offset per module. If a feed request fails the rail shows a Retry control rather than failing silently, and the rest of the page still loads.
Security Rating in the sidebar
The sidebar shows the Data Leaks sub-score of your overall ShadowMap Security Rating (a letter grade plus a number). A muted dash (—) means the score has not been computed for your tenant yet — it is not a failing grade. See Security Rating for how the score is calculated.
Understanding the data
Metrics strip
Nine cards across the top (they wrap onto a second row). Every card is clickable and jumps to the relevant module, date-filtered where that module windows by discovery date:
| Card | Meaning |
|---|---|
| Total Exposures | Sum of all seven module counts, for the selected range |
| Critical + High | Active high-priority exposure across all modules (from Program Impact) |
| Leaked Credentials | Exposed-credential count (lifetime) |
| Code Repositories | Visible-scope repository count (lifetime) |
| Leaked Files | Leaked document count |
| API Exposures | Leaked API count |
| Docker Containers | Exposed container image count |
| S3 Buckets | Publicly readable bucket count |
| Shortened URLs | Exposed short-link count |
No trend arrows
These cards show counts only — there is no period-over-period up/down arrow. A real "since last period" delta is not yet wired into the strip (although the backend now computes a previous-period comparison for future use), and a fake arrow that implied growth on every populated card was deliberately removed. Use the time-range selector to compare windows manually.
If the totals request fails, the whole strip renders an error state with a Retry button rather than silently showing zeros — a change made so an outage never reads as "zero exposure."
Module Health Matrix
A single table with one row per module (all seven, Leaked Credentials included) and a shared set of lifecycle columns, so you can see at a glance where the open work sits across the whole program:
| Column | Meaning |
|---|---|
| Module | The Data Exposure source |
| Active / Open | Findings still needing review / not yet actioned |
| Critical / High | High-priority findings in that module (for Leaked Credentials this is confirmed working secrets) |
| Detected in Range | New findings whose discovery date falls inside the selected window |
| Investigating | Findings currently under analyst investigation |
| Action Pending | Findings queued for takedown / remediation |
| Resolved | Taken down or no longer exposed |
| Dismissed / Reviewed | False positives and accepted/reviewed items |
| AI Filtered | Findings the AI review filtered out of the queue |
| Top Action | The suggested next step for that module |
Every non-zero count is a link straight to the module tab that owns it (e.g. Active → the needs-review tab); a zero or unavailable count is plain text, not a link. The date-scoped columns respect the header time range.
Program Impact
A date-scoped summary of what the program has produced, as six tiles plus a workflow row. The tiles:
| Tile | Meaning |
|---|---|
| Total Exposures Found | All exposures detected in the selected range |
| Active Backlog | Findings still open across all modules |
| Critical / High | Active high-priority exposure |
| Resolved / Offline | Removed or no longer exposed |
| AI Queue Reduced | Findings AI review pulled out of the manual queue |
| Resolution Success | Percentage of requested takedowns that completed (resolved ÷ (pending + resolved)) |
Underneath, a workflow row shows Under Review, Pending Remediation, and Dismissed / Reviewed counts. Each tile and workflow item links to the module carrying the most of that metric, so you land where the work is.
Module Impact Graphs
One compact lifecycle card per module, turning raw counts into "found → open → in progress → actioned" posture. Each card shows the total Found, then Open, In Progress, and Actioned tallies, and a segmented bar broken down by lifecycle stage. The legend colours are consistent across every card:
| Segment | Colour | Meaning |
|---|---|---|
| Open | Red | Still needs review / not yet actioned |
| Being reviewed | Blue | Under investigation |
| Action pending | Amber | Queued for takedown / remediation |
| Resolved | Green | Taken down or no longer exposed |
| Reviewed / AI filtered | Grey | Dismissed, reviewed, or AI-filtered |
Here Open = active findings, In Progress = investigating + action-pending, and Actioned = resolved + dismissed/reviewed + AI-filtered. Each card links to that module's queue, and the card header carries the inline date-preset row that mirrors the header selector.
Recent Data Exposure Findings
An actionable cluster of the newest findings from the last 7 days, independent of the header time-range selector. Findings are grouped by type with a mixed-severity summary bar (Critical / High / Medium chips); each group and drill-down item links to its module or detail view. When there is nothing new it shows "No new data leaks in the last 7 days."
Data Exposure Summary
Replaces the old per-module bar chart with a plain-language read of the same totals. Two briefs sit side by side:
- For CISO — an auto-generated headline and one-line takeaway (e.g. whether Critical/High items need executive attention, or whether exposure is concentrated in one module vs spread across several), with chips for total exposures, critical/high count, and number of active modules.
- For SOC Analyst — where to start (the largest current queue) and which modules to triage first.
Below the briefs, a large total exposure figure sits next to a per-module breakdown list — each module with its count and its share of exposure as a percentage — and a module-mix donut with an "Exposure" center label. Colours are assigned per module and are consistent with the breakdown list.
Severity Distribution
Opens with a one-line summary (e.g. "X of Y findings need immediate attention" and which band the period is concentrated in), then an aggregate stacked bar across Critical / High / Medium / Low with a clickable legend showing each band's count and percentage. Below that, a per-module card for each risk-bearing module shows its name, its total flagged findings, a critical/high summary pill, and a row of risk badges.
Each badge spells out the full band name (e.g. CRITICAL, HIGH) plus its count — the earlier single-letter badge was replaced so severity is never conveyed by colour alone. The colour still encodes the band:
| Band | Colour | Meaning |
|---|---|---|
| Critical | Red | Highest-impact exposure for that module |
| High | Orange | Serious exposure requiring prompt action |
| Medium | Amber | Moderate exposure |
| Low | Green | Low-impact finding |
| Informational | Green (same as Low) | Contextual / informational finding |
| NA | Grey | Unclassified / no risk value |
Only modules that carry a risk value appear here — Code Repositories, Docker Containers, S3 Buckets, Leaked APIs, and URL Shorteners. Leaked Files (classified by threat level, below) and Leaked Credentials are not in this grid. Click a badge — or a segment/legend entry on the aggregate bar — to open that module filtered to the band.
Leaked File Types
A donut chart of the file types found in Leaked Files (file extensions/categories, grouped by their leading type), with a "Files" center label and a Threat Level summary underneath. Threat levels come from the file-analysis verdict:
| Threat level | Display |
|---|---|
| Malicious / Suspicious | Red (danger) |
| Ambiguous | Amber (warning) |
| No verdict / No specific threat | Green (clean) |
| Other / unknown | Grey (neutral) |
Hash-named "types" (raw hex blobs with no real extension) are collapsed into a single Unknown slice rather than cluttering the chart with one slice per hash.
Top Exposed Subdomains
A single merged table combining the two subdomain-attributable sources — Leaked APIs and URL Shorteners — into one ranked list (top 10 by count, highest first):
| Column | Meaning |
|---|---|
| Sub-domain | The subdomain the exposures are attributed to. When ShadowMap knows the matching inventory asset, this links to its Subdomains detail |
| Source | API (cyan) or URL Shortener (purple) — which scanner found it |
| Count | Number of exposures attributed to that subdomain from that source |
This answers "which of my subdomains is leaking the most?" at a glance, regardless of which of the two sources surfaced it.
Filtering & search
The overview has exactly one filter: the time-range selector in the header (7 / 30 / 90 days, 6 months, 1 year, or All time), which scopes every card and the feed simultaneously. The Module Impact Graphs card exposes the same presets inline as a button row, but it drives the same single selector — it is not a second, independent filter. Two things deliberately ignore the selector: the lifetime Code Repositories and Leaked Credentials totals, and the Recent Data Exposure Findings card (always the last 7 days). There is no free-text search, no per-column filter, and no export on this page — it is a read-only summary. To search, filter by status, or export, open the individual module pages, each of which has its own full filter set.
The feed sidebar has its own source filter (the "All / Selected" dropdown) to show only feed entries from specific modules — Code Repositories, S3 Buckets, Docker Containers, Leaked Files, Leaked APIs, or URL Shorteners. This affects only the feed, not the cards. You can also click a module badge on any feed row to filter the rail to just that source.
Taking action
The overview is a navigation hub. There is nothing to triage, resolve, or close here — every action routes you to a module page where the real work happens:
- Read the metrics strip and Module Health Matrix to find your dominant exposure module and the lifecycle stage holding the most work.
- Click a metric card or a matrix count to open that module on the exact tab (needs-review, investigating, takedown, etc.).
- Click a Program Impact tile to jump to the module carrying the most of that outcome (e.g. Critical / High, or takedowns pending).
- Click a Severity Distribution badge to open a module pre-filtered to a risk band — the fastest path to your Critical/High items.
- Click a feed entry or a Recent Findings row to open a specific finding's detail view.
- From the module list, work each item: validate, mark its severity & status, and where appropriate raise a takedown.
Triage flow
Set the range to All time for a complete picture, then switch to Last 7/30 days to isolate what is new since your last review. The Severity Distribution badges are the quickest route to the items that matter most.
Common questions
Why is my Total Exposures number higher than what I see inside a module? It usually is not — the overview deliberately uses the same visible scope as the modules (online, not dismissed) so they reconcile. If they still differ, check the time range: the overview and the module may be on different windows. Remember the total is a sum across seven modules, so the same underlying exposure can contribute to more than one module's count.
I switched to "Last 7 days" and most cards went to zero. Is the data gone? No. For the five windowed modules the range filters by discovery date, so exposure found more than 7 days ago drops out of the count. Switch to All time to see your full standing exposure. (Code Repositories and Leaked Credentials are counted lifetime, so they do not zero out on a short range.)
Why do the severity badges and the destination list sometimes show slightly different counts? Severity badges are scoped to the visible/online population; clicking one lands you on the module's All (or default) tab, which is a superset that may include a few offline or dismissed rows. This is intentional so that nothing the badge counted is ever missing from the list.
Why are there no trend arrows on the metric cards? Period-over-period deltas are not yet wired into the strip. Rather than show a misleading arrow, the cards display counts only. Compare windows manually with the time-range selector.
Why isn't Leaked Files in the Severity Distribution? Leaked Files are classified by an analysis threat level (malicious / suspicious / ambiguous / clean), shown under the Leaked File Types donut, not by a Critical/High/Medium/Low risk band. Leaked Credentials is also excluded from the severity grid. The other five modules use risk bands and appear there.
The Security Rating shows a dash. Is that an F? No. A dash means the Data Leaks sub-score has not been computed for your tenant yet. An actual failing grade renders as a letter (e.g. F) with a number.
Why doesn't the time range reset when I come back later? By design — your selection is saved in the browser per module so you return to the same window you left.
Related
- Data Leaks — the parent module and full list of sources.
- Code Repositories — exposed public source code, secrets, and internal references.
- Leaked Files — documents exposed on sharing and sandbox services.
- Leaked APIs — exposed API endpoints, source of the API rows in Top Exposed Subdomains.
- Docker Containers — public container images scanned for leaked secrets.
- S3 Buckets — publicly readable cloud storage.
- Shortened URLs — exposed short links, source of the URL Shortener rows in Top Exposed Subdomains.
- Leaked Credentials — exposed usernames, passwords, and keys; now included in the Total Exposures roll-up and the metrics strip.
- Security Rating — how the Data Leaks sub-score in the sidebar is calculated.
- Severity & Status — how to triage the findings you reach from here.