
Dark Web Overview
The Dark Web Overview is the landing page for the Dark Web module. It rolls up findings from four underground intelligence sources — third-party breach dumps, info-stealer malware logs, ransomware/forum discussions, and Telegram channels. The page is triage-first: it leads with a unified What needs action now queue that merges the still-open findings from all four sources into one worst-first list, then keeps the roll-ups — which of your domains are exposed, which users and executives are compromised, and whether dark-web activity against you is trending up — a click away in a collapsible Posture & trends section.
Overview
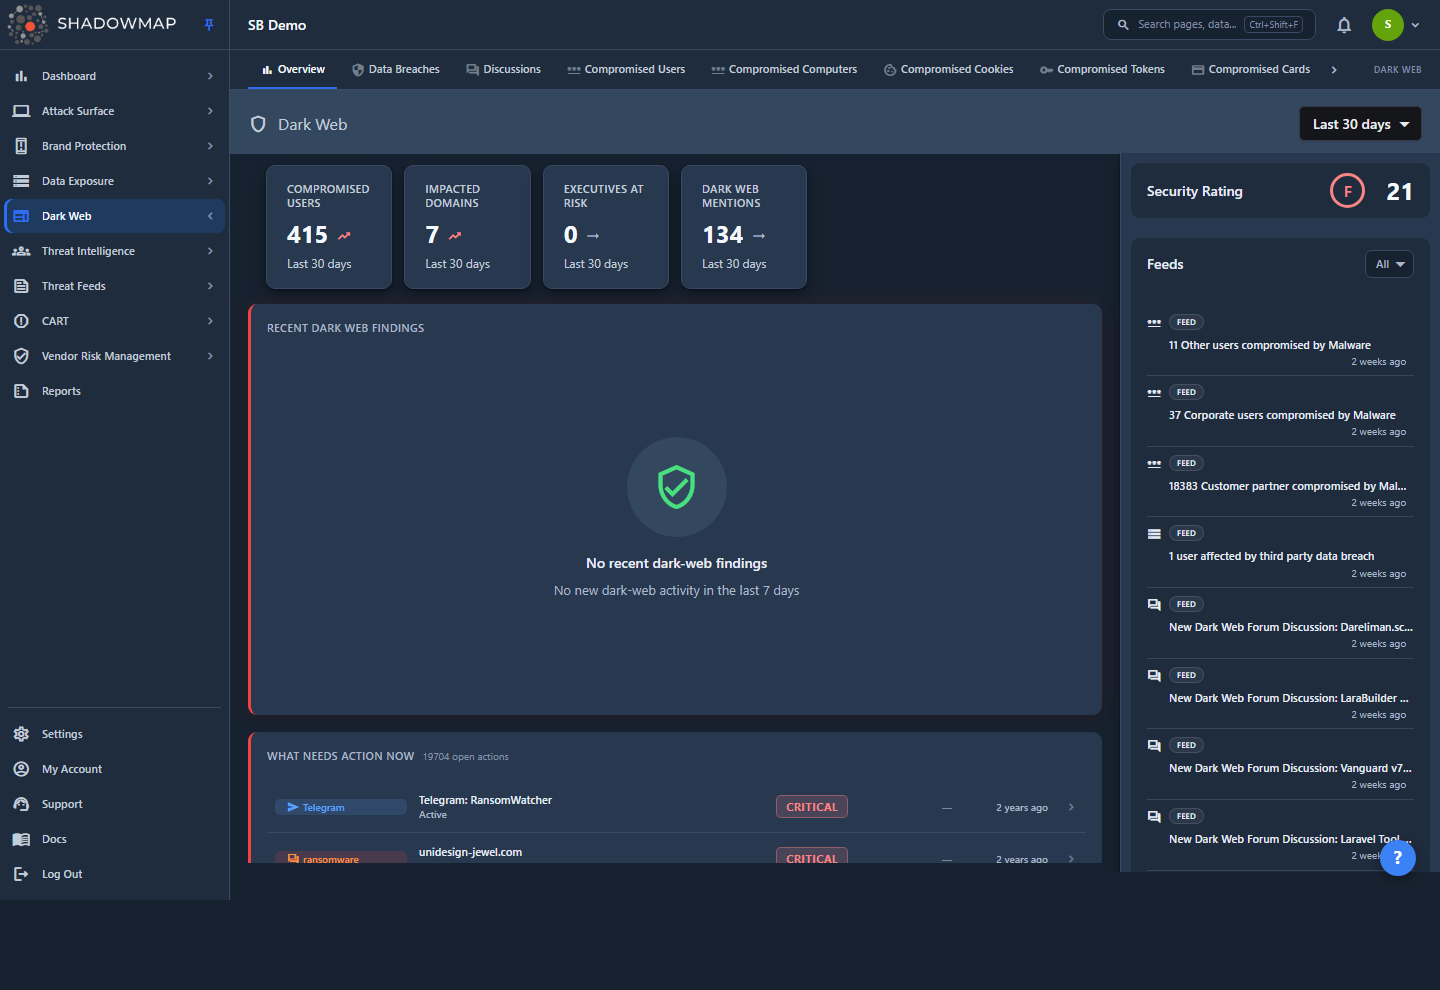
The page is organized top to bottom:
- A date-range selector in the header (top-right).
- A metrics strip of four headline KPIs.
- A Recent Dark Web Findings cluster — actionable findings from the last 7 days.
- What needs action now — the primary panel: a unified, ranked, cross-module triage queue.
- A collapsible Posture & trends section (collapsed by default) holding the Threat Trends charts and the Most Impacted Domains (with an All / Priority toggle), Most Impacted Users, and Most Impacted Executives lists.
- A Feeds sidebar on the right showing the module's Security Rating and a live, filterable activity feed.
This is a triage springboard, not a workspace. Both the triage-queue rows and the activity feed link each finding back to its record-level module — Data Breaches, Stealer Logs, Discussions, and Telegram — where you triage and act on individual findings. The KPI cards, ranked lists, and trend charts are read-only summaries; open a queue row or feed item, or use the left-hand navigation, to reach the underlying module.
How it works
The mechanics below are not visible in the UI but determine exactly what each number means.
The underlying sources
The overview aggregates from four feed pipelines (the four categories you can filter the activity feed by), plus a fifth source label — Compromised User Data Auctions — that contributes only to the Most Impacted Domains ranking. Knowing which source feeds which widget tells you what a count actually represents:
| Source | What it collects | Feeds |
|---|---|---|
| Third Party Data Breaches | Your domains/emails appearing in breach corpora and dump repositories | Domains, Users, Executives, Compromised Users chart, Feed |
| Malware Compromised Passwords | Credentials harvested by info-stealer malware (stealer logs) | Domains, Users, Executives, Compromised Users chart, Feed |
| Compromised User Data Auctions | Stealer-log datasets sold/auctioned, mapped to your domains | Most Impacted Domains only |
| Ransomware Groups & Forums | Ransomware leak-site posts and deep-web forum discussions naming you | Dark Web Conversations chart, Feed |
| Telegram Conversations | Threat-actor Telegram channels/groups mentioning your organization | Feed |
What each hero metric counts
The four KPI cards are computed server-side from the same impacted-systems, impacted-users, and impacted-executives data that drives the ranked lists, scoped to the date range you select in the header. The "Dark Web Mentions" card is pulled from the Discussions summary for the same window.
| KPI card | What it counts |
|---|---|
| Compromised Users | Sum of impacted user records across Third Party Data Breaches + Malware Compromised Passwords |
| Impacted Domains | Number of distinct domains/subdomains appearing across all impacted-systems sources |
| Executives at Risk | Sum of impacted records tied to your configured executive list (breaches + malware) |
| Dark Web Mentions | Total discussion/conversation mentions of your organization (Discussions summary) |
The card subtitle echoes the active date preset (e.g. "Last 30 days") so the number and its window stay consistent.
Priority domains
The All / Priority toggle on Most Impacted Domains splits results using your priority (relevant) domains configuration. A domain counts as "priority" when it has been assigned a priority level above zero in settings. Internally the page fetches priority domains separately and partitions every impacted-domain result into the two buckets, so the two views never overlap. Use Priority to focus on crown-jewel assets and suppress the noise of low-value domains.
Trend charts are scoped by calendar year
The Threat Trends charts plot one bar per month (Jan–Dec) for a single calendar year. They are driven by their own per-chart year navigation, not by the header date preset. The two charts navigate independently:
- Compromised Users plots two series per month — third-party-breach users and malware-compromised users.
- Dark Web Conversations plots monthly ransomware/forum discussion volume.
Use the chevron buttons beside each chart's year label to move between years. The forward button is disabled once you reach the current year. If a year has no positive activity, the chart is replaced by an inline "No data" state rather than rendering an empty axis.
Ranked lists are top-10, sorted by count
Most Impacted Domains, Users, and Executives each flatten their per-source groups into a single list, sort descending by count, and show the top 10. The small label on the right of each row tells you which source the row came from (e.g. Third Party Data Breaches, Malware Compromised Passwords, Compromised User Data Auctions). Executives are restricted to the people configured in your organization's executive list.
Understanding the data
What needs action now
The primary panel is a single, worst-first triage queue that merges the still-open findings from all four dark-web sources so you can work across modules from one surface instead of four tabs. Its subtitle shows the total number of open actions the queue draws from (e.g. "128 open actions").
| Column | Meaning |
|---|---|
| Source badge | Which source the row comes from — a data breach, a compromised user (stealer log), a ransomware/forum discussion, or a Telegram conversation |
| Title & status | The finding's title with its current status beneath (e.g. Needs Action, Active) |
| Severity | A normalized severity chip (Critical / High / Medium / Low / Info) used to rank the row |
| Blast radius | For credential-leak rows, the count of your still-open accounts in the same breach event or from the same infected machine. Chatter rows (discussions, Telegram) show a dash — blast radius does not apply. A row that can't be attributed to a group shows "Needs data" instead of a fabricated number. |
| Age | How long ago the finding was first seen |
Rows are ordered worst-first: by severity band, then by recency. Clicking a row opens that finding directly in its owning module's detail view. The queue is the full open universe of dark-web findings — an open finding does not "age out" — so, unlike the KPI cards and ranked lists, it is not scoped by the header date range.
Recent Dark Web Findings
A compact, actionable cluster of new dark-web findings from the last 7 days, grouped by finding type with a severity-summary bar. Expand a group to see individual items, or click through to the owning module. This window is fixed at 7 days and does not follow the header date range.
Posture & trends (collapsible)
The remaining widgets — the Threat Trends charts and the three Most Impacted lists below — live inside the Posture & trends section, which is collapsed by default so the triage queue stays the focal element. Expand it to see the longer-term roll-ups.
Most Impacted Domains
A flat, ranked list of the domains and subdomains appearing most often in dark-web data.
| Element | Meaning |
|---|---|
| Count badge | Number of findings tied to that domain/subdomain |
| Domain / subdomain | The asset; if a subdomain is present it is shown with its parent domain beneath |
| Source label | Which pipeline produced the row (breaches, malware, or auctions) |
| All / Priority toggle | Switch between all impacted domains and only your priority domains |
Most Impacted Users and Executives
| Element | Meaning |
|---|---|
| Count badge | Number of dark-web findings for that identity |
| Name | The impacted user identifier (email/username) or executive |
| Source label | Third Party Data Breaches or Malware Compromised Passwords |
A high count for one user
A single user appearing repeatedly in Malware Compromised Passwords usually points to a persistently infected device — the same machine re-uploading fresh stealer logs. Treat it as a device-compromise investigation, not just a password reset.
Feeds sidebar
The right rail shows two things:
- Security Rating — the letter grade and score for the Dark Web category. A muted "—" means the score has not loaded for this tenant (it is not a failing grade).
- Feeds — recent dark-web findings in reverse-chronological order, each with a source icon, a human-readable title, a "… ago" timestamp, and a link into the originating module.
Filter the feed with the dropdown. The categories are:
| Filter | Source |
|---|---|
| Third Party Data Breaches | Breach dumps |
| Malware Compromised Passwords | Stealer logs |
| Ransomware Groups & Forums | Ransomware leak sites + deep-web forums |
| Telegram Conversations | Telegram channels |
Selecting none shows everything; selecting one or more narrows the feed. The filter is applied client-side to the feed items already loaded for the selected window.
Filtering & Search
The header dropdown sets the time window for the page. It scopes the hero KPI cards, the ranked Most Impacted lists, and the activity feed. Three panels ignore it: the Threat Trends charts use their own per-year navigation, the What needs action now queue always shows the full open universe, and Recent Dark Web Findings is fixed to the last 7 days. Presets:
| Preset | Window |
|---|---|
| Last 7 days | Rolling 7 days |
| Last 30 days | Rolling 30 days (default) |
| Last 90 days | Rolling 90 days |
| Last 6 months | Rolling 180 days |
| Last 1 year | Rolling 365 days |
| All time | Entire history |
Your selection is remembered per browser via local storage, so the page reopens on the range you last used.
Taking action
The overview is a triage springboard, not a workspace — you resolve findings in the underlying modules:
- Start with the queue — What needs action now ranks every open finding worst-first across all four sources, so the top of the list is where to begin.
- Open the finding — click a queue row (or a feed item) to jump straight to its record in Data Breaches, Stealer Logs, Discussions, or Telegram; or use the left-hand navigation to open a module directly.
- Triage the records there — review, mark status, request credential resets, or initiate takedowns where supported.
Read access
Viewing this page requires the Dark Web Overview read permission. Your administrator manages this under member roles.
Common questions
Why does "Compromised Users" show a big number when the trend chart for this year is empty? The hero cards and the trend chart use different windows. The cards follow the header date preset, while each trend chart shows only the calendar year you've navigated to. A large card total alongside an empty current-year chart usually means the compromises landed in an earlier year — page back through the chart's year navigation to find them.
What's the difference between the "All" and "Priority" domain views? "All" is every impacted domain outside your priority list; "Priority" is restricted to domains you've flagged as high-value (priority level above zero) in your relevant-domains settings. Use Priority to cut through noise from low-value or parked domains.
The Dark Web Conversations chart is empty — does that mean we're safe? It means no ransomware leak-site posts or deep-web forum discussions naming your organization were collected in that year. It does not cover stealer-log credentials or breach data — those are tracked by the Compromised Users chart and the breach/stealer modules.
What does the source label on each row mean? It attributes the finding to its collection pipeline (e.g. Malware Compromised Passwords vs Third Party Data Breaches). The same domain or user can appear under more than one source because the same identity may be exposed in multiple ways.
Why is the Security Rating showing "—"? The Dark Web category score hasn't loaded for your tenant yet. It is a placeholder, not a zero or an F.
Why doesn't the "What needs action now" count change when I switch the date range? The queue shows every still-open dark-web finding across all four sources, and an open finding does not "age out" of triage — so it deliberately ignores the header date preset. The KPI cards, ranked lists, and activity feed do follow the preset.
A queue row's blast radius says "Needs data" or shows a dash — why? Blast radius counts how many of your accounts are still open in the same breach event or from the same infected machine, so it applies only to credential-leak rows (breaches and stealer logs). Discussion and Telegram rows show a dash because a mention has no per-account count. "Needs data" appears when a credential-leak row can't be attributed to a group — the platform shows the placeholder rather than a fabricated number.
Related
- Data Breaches — record-level third-party breach findings that feed the impacted-domains, users, and executives rankings.
- Stealer Logs — malware-harvested credentials behind the "Malware Compromised Passwords" source and the Compromised Users metric.
- Automated Mitigation — subdomain rules that auto-resolve stealer-log credentials so known-handled floods skip the triage queue.
- Compromised Computers — the infected devices that produced the stealer-log credentials.
- Discussions — ransomware leak-site and forum posts that drive the Dark Web Conversations chart.
- Telegram — threat-actor Telegram activity surfaced in the feed.
- Credit Card Leaks — payment-card exposure tracked alongside the dark-web sources.
- Leaked Credentials — credentials found on open/public sources, distinct from the dark-web stealer and breach pipelines here.
- Security Rating — dark-web findings contribute to the category grade shown in the Feeds sidebar.