
Leaked APIs
Surfaces API endpoints, keys, and authentication tokens tied to your organization that are publicly reachable or referenced in public sources — internal microservices exposed to the internet, staging APIs running in production, Swagger/OpenAPI specs leaking your full surface, and keys baked into client-side bundles. Each finding is scored, deduplicated, and tracked through a triage workflow so you can decide what to authenticate, restrict, or take offline.
Overview
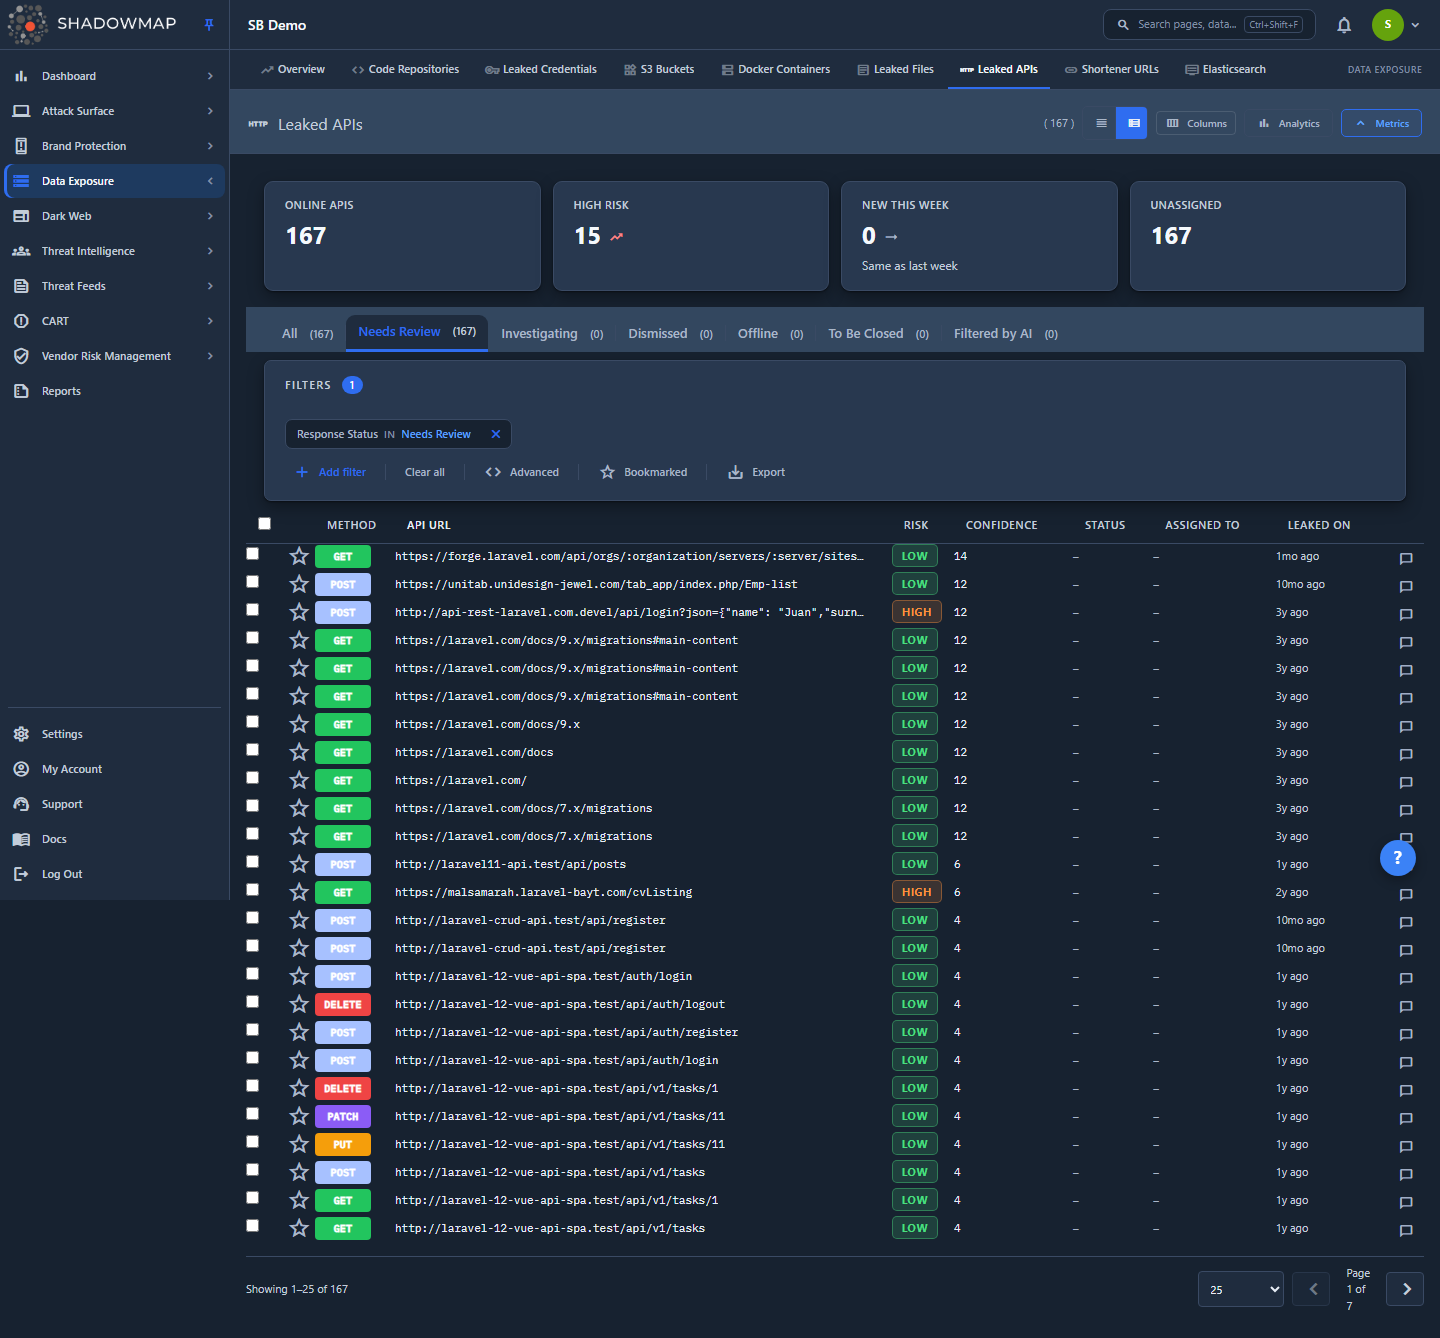
The page is a triage workbench for exposed APIs. The top of the view carries an optional KPI strip (Online APIs, High Risk, New This Week, Unassigned) and a collapsible analytics panel (detection trend, risk distribution, HTTP-method breakdown, top keywords). Below those sit status tabs, a filter bar, and a sortable table of findings. Each row shows the HTTP method, the full API URL, a risk and confidence value, status, assignee, and when it was leaked. If your tenant has AI review enabled, each row also carries the AI verdict, AI score, and AI tags. A compact / expanded density toggle in the page header switches between denser and roomier rows.
Clicking a row opens a side drawer for fast triage — overview, a request inspector, related assets, and comments — without leaving the list. Pressing Enter (or the expand icon) opens the full detail page. Selecting rows with the checkboxes reveals a bulk action bar for assigning, changing status, exporting, or sharing many findings at once.
Where this sits
Leaked APIs is part of the Data Leaks module group, alongside Code Repositories, Leaked Credentials, and S3 Buckets. A single exposed endpoint frequently correlates with findings in those modules — the drawer's Related tab makes those links explicit.
How it works
These are the mechanics you cannot read off the screen.
What gets detected. ShadowMap finds exposed APIs through several discovery paths, then verifies them by active probing:
- Public code scanning — endpoint URLs and API keys committed to GitHub, GitLab, and other public repositories.
- Documentation scraping — Swagger/OpenAPI specs and GraphQL introspection endpoints exposed on public-facing servers, which reveal your full API surface.
- Subdomain enumeration — API hostnames (
api.example.com,api-staging.example.com) discovered through DNS enumeration of your attack surface. - Active probing — confirmation that a discovered endpoint actually responds and is reachable, so the list reflects live exposure rather than stale references.
Attribution by keyword. Every finding is matched to your organization through a keyword — the brand term, domain, or identifier that tied the endpoint back to you. The keyword is shown on each finding and is one of the filter and analytics dimensions, so you can trace why a given API was attributed to your tenant.
Risk scoring. Each finding carries a Risk of High, Medium, or Low, derived from the endpoint's sensitivity and exposure — broadly, authentication and write-capable endpoints reachable without auth rank highest, internal APIs exposed to the internet rank high, development/staging endpoints rank medium, and non-sensitive public endpoints rank low. The drawer can additionally show Sectional Risk — a per-section breakdown (for example, by request component) when the scanner produced one — so you can see which part of the request drives the score. The list defaults to sorting by Risk, descending, so the highest-impact exposures sit at the top. On the Needs Review tab, tenants with AI review enabled default instead to AI Score, descending (worst-first triage) until you click a column header to choose your own sort.
Confidence. Alongside risk, each finding has a Confidence value indicating how certain ShadowMap is that the endpoint is genuinely yours and genuinely exposed (versus a probable false positive). Use it to prioritize within a risk band — a High-risk, high-confidence endpoint is your first stop.
AI assessment. If your tenant has AI review enabled, each finding is additionally scored by an AI triage model that surfaces three advisory signals: an AI Verdict (a colored assessment badge), an AI Score (a numeric 0–1000 triage confidence, sortable), and AI Tags (controlled-vocabulary content and sensitivity chips). These are decision support, not automatic actions — you still triage each finding. The AI can also move low-value noise into a dedicated Filtered by AI queue (status Filtered By AI), which is written only by the AI engine and is never a status you set by hand. Tenants without AI review enabled see none of these columns, tabs, or filters, and the layout is unchanged.
Aging. The drawer shows days open for each finding, color-coded: under 30 days is fine, over 30 days is a warning, and over 90 days is flagged critical. This is your aging signal for exposures that have lingered unaddressed.
Status model. Leaked APIs uses its own status set, distinct from other modules. A finding has an internal scanner state (is it still live? — online or offline) and an analyst-set response status. The tabs combine the two:
- Every online tab — Needs Review, Investigating, Dismissed, To Be Closed, and Filtered by AI — scopes to findings the scanner can still reach, partitioned by response status. Needs Review holds the still-live, untriaged findings (no response status, or
New/Reopened); the others hold live findings you (or the AI) have moved into that state. - Offline holds findings the scanner can no longer reach (the endpoint was secured or taken down) as well as anything an analyst marked
Closed.
Marking a status does not delete a finding — it moves it between tabs and records who did it. If the endpoint becomes reachable again, the scanner reopens it back into Needs Review.
Deduplication and re-detection. Findings are keyed to the endpoint, so the same exposed API is one row that re-detects across scans rather than a new row each time. A finding you accept or close that comes back online reopens automatically rather than silently disappearing.
Trend semantics. On the KPI strip, New This Week shows a week-over-week trend that is colored by threat meaning, not raw direction: an increase is red (more exposure is bad) and a decrease is green. The analytics 6-Month Detection Trend chart plots new versus closed findings per period so you can see whether you are closing exposures faster than they appear.
Understanding the data
Columns
The table is column-customizable (the column picker is in the page header). API URL is always shown and cannot be hidden. The three AI columns appear only for tenants with AI review enabled; they are off by default and are hidden from the column picker entirely when AI review is not available.
| Column | Description |
|---|---|
| Method | HTTP method observed for the endpoint — GET, POST, PUT, PATCH, or DELETE, shown as a color-coded badge. |
| API URL | Full URL of the exposed endpoint, including subdomain and path. A copy button puts it on the clipboard. Always visible. |
| Risk | High, Medium, or Low, color-coded. |
| Confidence | Numeric confidence that the finding is a genuine exposure attributable to you. |
| Status | Current response status (see below). Blank means untriaged. |
| AI Verdict | The AI triage model's assessment badge (AI-enabled tenants only; off by default). |
| AI Score | Numeric AI triage confidence, 0–1000. Sortable. (AI-enabled tenants only; off by default.) |
| AI Tags | Controlled-vocabulary content and sensitivity chips from the AI model (AI-enabled tenants only; off by default). |
| Assigned To | Initials of the analyst the finding is assigned to, or blank. |
| Leaked On | When the exposure was first seen, shown as relative time (for example, "3 days ago"). |
| Keyword | The keyword that attributed this API to your organization (off by default; enable via the column picker). |
HTTP methods
Method matters because write-capable endpoints reachable without authentication are the most dangerous.
| Method | Why it matters |
|---|---|
GET | Data retrieval. An exposed GET endpoint may leak data to unauthenticated callers. |
POST | Data submission. May allow unauthorized creation or manipulation of records. |
PUT | Full update. May allow unauthorized modification of existing records. |
PATCH | Partial update. Same class of risk as PUT, for partial changes. |
DELETE | Deletion. Enables destructive actions if reachable without auth. |
WARNING
POST, PUT, PATCH, and DELETE endpoints that are publicly accessible without authentication are the highest-priority findings — they permit write and destructive operations, not just data disclosure.
Statuses
Findings move through a response workflow. The status you set determines which tab a finding lives in.
| Status | Meaning |
|---|---|
| New | Freshly detected, not yet triaged. Appears under Needs Review. |
| Reviewed (Public) | Confirmed and acknowledged — typically an intentionally public, documented API. (Stored internally as Public; shown as Reviewed.) Appears under Dismissed. |
| To Be Closed | Queued for closure once remediated. Appears under To Be Closed. |
| Accepted Risk | A known exposure you have consciously chosen to accept. Appears under Dismissed. |
| Investigating | Under active investigation. Appears under Investigating. |
| False Positive | Confirmed not a real exposure (for example, an intentionally public endpoint that is not yours, or a misattribution). Appears under Dismissed. |
| Filtered By AI | Moved aside by the AI triage model as low-value noise. Written only by the AI engine — you cannot set it by hand. Appears under Filtered by AI (AI-enabled tenants only). |
| Reopened | A previously triaged finding that came back online. Returns to Needs Review. |
| Closed / Offline | The endpoint is no longer reachable, or was marked taken down. Appears under the Offline tab. |
The drawer's set-status menu offers Public, To Be Closed, Accepted Risk, Investigating, and False Positive; the bulk bar offers the same set except Accepted Risk. The Dismissed tab merges the three "put-aside" states — Public (Reviewed), Accepted Risk, and False Positive — into one queue, so anything you dismiss for any of those reasons lands there.
Status tabs
The tabs slice the queue by triage state and carry live counts:
| Tab | Shows |
|---|---|
| All | Every finding, without status scoping (your filters and search still apply). |
| Needs Review | Live, untriaged findings — your primary work queue. |
| Investigating | Live findings under active investigation. |
| Dismissed | Live findings you have put aside — Public (Reviewed), Accepted Risk, and False Positive, merged into one queue. |
| Offline | Endpoints the scanner can no longer reach, or that were marked Closed. |
| To Be Closed | Live findings queued for closure. |
| Filtered by AI | Findings the AI triage model set aside as low-value noise. Shown only for tenants with AI review enabled. |
Filtering & search
The filter bar combines free-text search with nine structured filter fields. Filters compile to removable pills; clearing all resets the view.
| Filter | Behavior |
|---|---|
| Status | Scanner reachability — Online or Offline. |
| Response Status | The triage state — Needs Review, Investigating, Dismissed, To Be Closed, or Filtered by AI. |
| API URL | Match on the endpoint URL or subdomain. |
| Method | One or more of GET, POST, PUT, PATCH, DELETE. |
| Risk | One or more of High, Medium, Low. |
| Assignee | Filter by the analyst a finding is assigned to. |
| Leaked On | Date range (or a "last 7 days" shortcut) against when the exposure was seen. |
| Keyword | The attribution keyword that tied the API to your org. |
| Confidence | Filter by confidence value. |
Tenants with AI review enabled get two more fields — AI Assessment (filter by AI verdict) and AI Tags (filter by the AI content/sensitivity tags).
Plain text typed into the search box matches the API URL. Every sortable column (Method, API URL, Risk, Confidence, Leaked On, and — when AI review is enabled — AI Score) sorts ascending or descending by clicking its header.
One-click drill-down
Most KPI cards and most analytics charts are clickable. Clicking the High Risk card filters to High-risk findings, and New This Week filters to the last 7 days; the Online APIs card jumps to the Needs Review tab. (The Unassigned card is a read-only count.) Clicking a slice of the Risk Distribution donut, a bar in the HTTP Methods chart, or a bar in Top Keywords applies the matching filter instantly. The current tab, page, sort, and filters are also written into the URL, so a filtered view is shareable and bookmarkable by copying the link.
The Bookmarked toggle in the filter row restricts the list to findings you have starred. Bookmark a row with its star icon (or press s with the drawer open).
Detail view
Clicking a row opens the drawer; clicking the expand icon (or pressing Enter) opens the full detail page. The drawer has four tabs:
- Overview — API URL, method, the Source URL where the exposure was discovered (linked), the attribution keyword, when it was leaked and last updated, and the Sectional Risk breakdown when available. A header row shows risk, confidence, days-open aging, and the current assignee.
- API Inspector — the request shape captured by the scanner: Parameters, Authentication, Body, and Headers, each rendered as formatted JSON. This is where you confirm whether the endpoint actually requires auth and what it accepts.
- Related — linked assets across modules: Domains, S3 Buckets, and Leaked Files connected to this endpoint, with a risk badge shown for related domains and buckets. Use this to size blast radius — an exposed API plus a related open bucket is a bigger story than either alone.
- Comments — internal notes on the finding, with comment templates available.
From the drawer header you can change status, request a takedown, or share the finding to a connected integration. Use j / k to move to the next/previous finding, x to toggle selection, s to bookmark, and Esc to close.
Taking action
Per-finding actions
| Action | What it does |
|---|---|
| Change status | Set Public (Reviewed), To Be Closed, Accepted Risk, Investigating, or False Positive. |
| Request takedown | Opens the takedown form, which collects the required legal-authorization attestation before submitting. |
| Share via integration | Push the finding to a connected tool (Jira, ServiceNow, Slack, and similar). |
| Assign / clear assignee | Route the finding to an analyst, or unassign it. |
| Comment | Add internal notes, optionally from a template. |
| Bookmark | Star a finding for your filtered shortlist. |
Bulk actions
Select rows with the checkboxes (the header checkbox selects the page) to reveal the bulk bar, which can Assign, Clear Assignee, set Public, To Be Closed, Investigating, or False Positive, Export, or Share the entire selection in one operation.
Export
The Export button (in the filter row and the bulk bar) generates an Excel export of the current filtered, sorted view as a background task — you are notified when the file is ready. The export honors the active tab, filters, sort, and search term, so it matches what you see on screen.
Recommended response
When a genuine exposure is confirmed:
- Determine intent. Is this a documented, intentionally public API, or an internal/staging endpoint that leaked? Mark documented public APIs as Reviewed; treat everything else as an exposure.
- Add authentication. If the endpoint should not be public, require auth immediately — API-key validation at minimum, OAuth 2.0 or mutual TLS for sensitive endpoints.
- Restrict network access. Use firewall rules, security groups, or API-gateway policies to limit who can reach internal APIs.
- Rotate exposed keys. If keys were found in public code, rotate them and move to managed secret storage.
- Disable unneeded methods. If a public API only needs
GET, blockPOST/PUT/PATCH/DELETEat the gateway. - Remove public docs for internal APIs. Swagger UI, OpenAPI specs, and GraphQL introspection should not be reachable on internal services.
- Add rate limiting. Public endpoints without limits invite scraping and abuse.
Once remediated, set To Be Closed; the finding moves to Offline when the scanner confirms it is no longer reachable.
Common questions
What is the difference between Risk and Confidence? Risk is how damaging the exposure would be if abused (driven by sensitivity, method, and reachability). Confidence is how certain ShadowMap is that the finding is genuinely yours and genuinely exposed. Sort by Risk to prioritize impact; use Confidence to break ties and avoid chasing likely false positives.
Why is an intentionally public API showing up here? Discovery is broad by design — it surfaces everything reachable that maps to your keywords, including legitimate public APIs. Mark documented, intentional public endpoints as Reviewed (Public) so they drop out of Needs Review, or False Positive if they are not actually yours.
A finding I closed reappeared. Why? Findings re-detect against the live endpoint. If something you accepted or closed becomes reachable again, it reopens into Needs Review rather than staying hidden — so you never lose track of an exposure that came back.
What does "Offline" mean — is the finding gone? No. Offline means the scanner can no longer reach the endpoint (it was secured or taken down) or it was explicitly marked taken down. The record is retained for history and will reopen if the endpoint returns.
How do I find the most urgent items quickly? Stay on Needs Review — sorted by Risk by default, or by AI Score if your tenant has AI review enabled — and click the High Risk KPI card or the Risk donut to filter. Within High risk, prefer high-confidence, write-capable methods (POST/PUT/PATCH/DELETE), and watch the days-open aging badge for stale exposures.
Does the export include everything or just what I'm looking at? Just the current view. The export applies the active tab, filters, sort, and search term, so it mirrors the on-screen list. Widen filters first if you need the full set.
Related
- Code Repositories — many leaked endpoints and keys are first found in public repos; the source there often corresponds to a finding here.
- Leaked Credentials — exposed API keys and tokens overlap with credential exposure.
- S3 Buckets — an exposed API plus a related open bucket appears together in the drawer's Related tab.
- Data Leaks Overview — module-group dashboard summarizing exposure across all Data Leaks sources.
- Web Applications — the broader application surface that exposed API hosts belong to.
- Takedowns — how the takedown request you submit from the drawer is processed.
- Severity & Status — how risk and status conventions work across modules.