Elasticsearch Instances
ShadowMap detects publicly accessible Elasticsearch databases associated with your organization. Unprotected Elasticsearch instances are among the most frequent causes of large-scale data exposure, as they can contain millions of records and are often deployed without authentication by default.
Overview
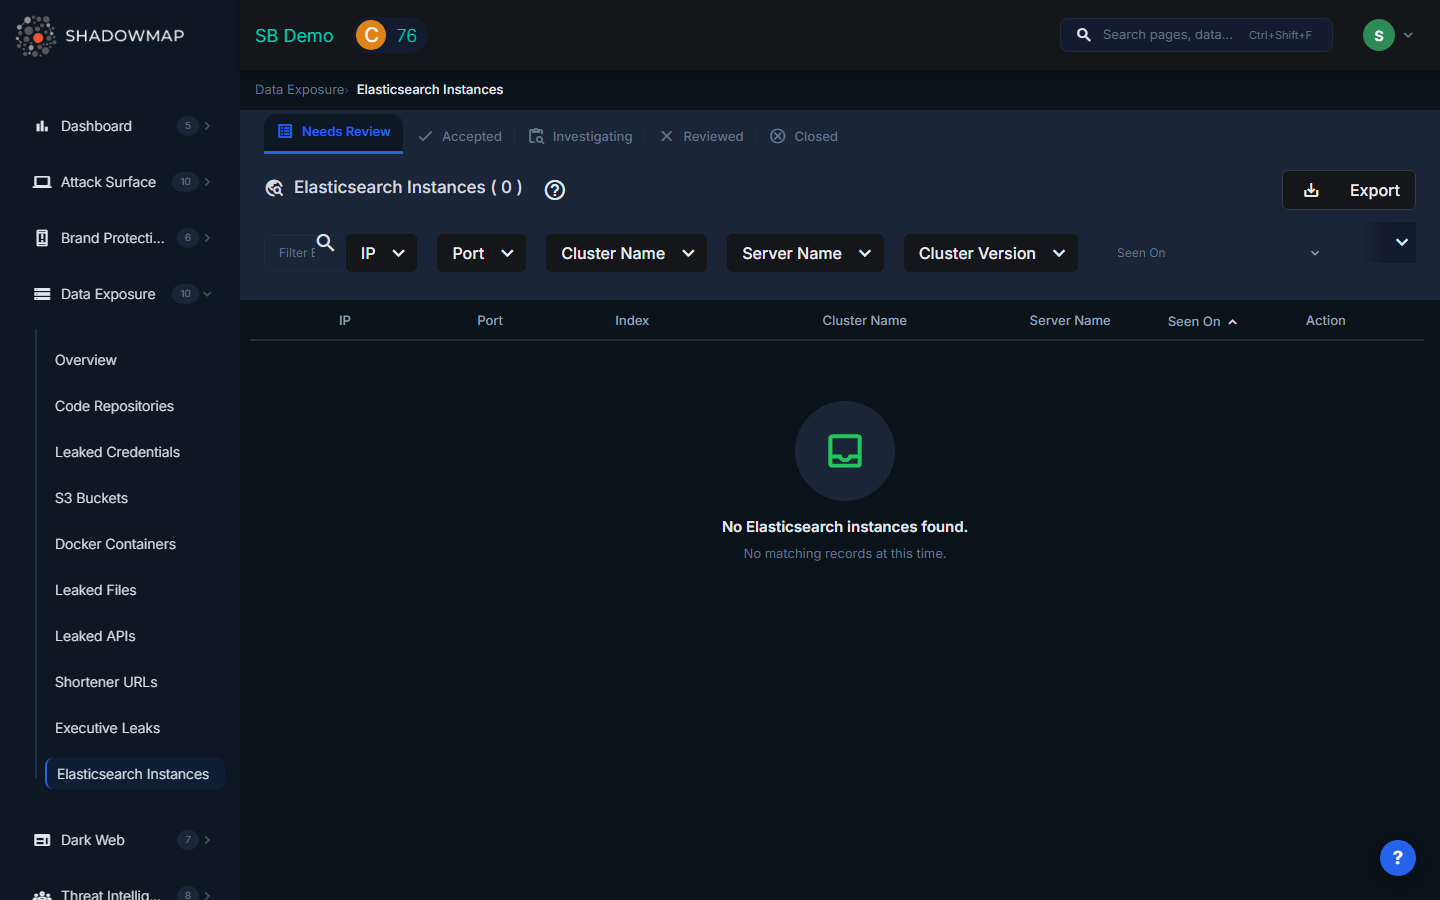
The listing page displays discovered Elasticsearch instances in a structured table with sortable columns. Results support bulk selection for batch operations, infinite scroll pagination, and rich filtering. The view is organized by status tabs (Needs Review, Accepted, Investigating, Reviewed, Closed).
Understanding the Data
| Column | Description |
|---|---|
| IP | The IP address where the Elasticsearch instance is running |
| Port | The port number (commonly 9200 for HTTP API, 9300 for transport) |
| Index | The Elasticsearch index name. Index names often reveal the type of data stored (e.g., customer_records, application_logs, user_sessions) |
| Cluster Name | The name of the Elasticsearch cluster. Default cluster names like elasticsearch or docker-cluster suggest a default/unconfigured deployment. |
| Server Name | The server hostname or node name within the cluster |
| Cluster Version | The version of Elasticsearch running. Older versions may have known vulnerabilities in addition to the exposure risk. |
| Seen On | When ShadowMap first detected this publicly accessible instance, shown as relative time with a tooltip showing the exact date |
What Exposed Elasticsearch Instances Might Contain
The data in an exposed Elasticsearch instance depends on how it was deployed, but common contents include:
| Data Category | Risk Level | Examples |
|---|---|---|
| Application logs | High | Logs containing user sessions, IP addresses, request/response bodies with PII, authentication tokens |
| Customer records | Critical | Full customer databases indexed for search: names, emails, phone numbers, addresses, purchase history |
| User session data | Critical | Active session tokens, JWTs, cookies that could enable account takeover |
| Internal metrics | Medium | Server performance data, error logs, deployment information revealing infrastructure details |
| Full-text documents | High | Indexed documents, emails, support tickets, internal communications |
| Financial data | Critical | Transaction records, payment information, invoice data |
| Healthcare data | Critical | Patient records, medical history, lab results (HIPAA-regulated) |
| IoT/sensor data | Medium | Device telemetry, location data, equipment status |
Filtering and Search
The filter bar provides:
- Text search -- Filter by IP address, cluster name, or server name
- IP -- Multi-select dropdown of discovered IP addresses
- Port -- Multi-select dropdown of observed ports
- Cluster Name -- Multi-select dropdown of cluster names
- Server Name -- Multi-select dropdown of server/node names
- Cluster Version -- Multi-select dropdown of Elasticsearch versions
- Date range -- Filter by when the instance was first seen ("Seen On")
Active filters appear as removable pills below the filter bar, with a "Clear All" option.
Available Actions
Individual Actions
| Action | Description |
|---|---|
| Mark as Needs Review | Move the finding back to the review queue |
| Mark as Accepted | Acknowledge the finding as valid |
| Mark as Investigating | Flag for active investigation |
| Mark as Reviewed | Dismiss the finding (e.g., intentionally public, or not your organization's) |
| Mark as Closed | Close the finding after remediation is complete |
| Comment | Add internal notes using free-text or pre-configured comment templates |
| Share via Integration | Push the finding to connected integrations (ServiceNow, Jira, etc.) |
| Export | Download all Elasticsearch findings in spreadsheet format |
Bulk Actions
Select multiple instances using checkboxes to perform batch operations:
- Bulk Mark as Needs Review
- Bulk Mark as Accepted
- Bulk Mark as Investigating
- Bulk Mark as Reviewed
- Bulk Mark as Closed
- Bulk Share via integrations
Status Workflow
Elasticsearch findings follow this lifecycle:
Needs Review --> Accepted (confirmed as your organization's)
Needs Review --> Investigating (under active investigation)
Needs Review --> Reviewed (dismissed as false positive)
Accepted --> Investigating
Accepted --> Reviewed
Accepted --> Closed (remediated)
Investigating --> Reviewed
Investigating --> Closed
Reviewed --> Needs Review (re-opened)
Response Guidance
Restrict access immediately. This is the highest priority action. Configure Elasticsearch security features or use network-level controls to block public access:
- Enable Elasticsearch's built-in security features (X-Pack Security) with authentication and TLS
- Configure firewall rules to restrict access to known IP ranges
- Use a reverse proxy with authentication in front of the Elasticsearch cluster
- Place the instance in a private subnet behind a VPN
Audit the exposed data. Determine what data was stored in the publicly accessible indices. Use the index names, cluster name, and version as starting points to identify the application or team that owns this instance.
Assess the exposure window. Determine how long the instance was publicly accessible. Check Elasticsearch logs (if available) and network logs for evidence of unauthorized access. Services like Shodan and Censys may have historical scan data showing when the instance first appeared publicly.
Notify affected parties. If the instance contained PII, customer data, or healthcare data, you may have regulatory notification obligations under GDPR, CCPA, HIPAA, or other data protection regulations. Consult with legal counsel to determine notification requirements.
Check for ransomware. Publicly exposed Elasticsearch instances are frequently targeted by automated ransomware bots that delete indices and leave ransom notes (often named
readmeorwarning). Check whether data has been deleted or modified.Update and patch. Older Elasticsearch versions have known security vulnerabilities. Update to the latest supported version and enable security features that may not have been available when the instance was originally deployed.
Review deployment practices. Determine how this instance was deployed without security controls and fix the root cause. Common issues include:
- Default configurations that bind to 0.0.0.0 (all interfaces)
- Docker containers with published ports and no network isolation
- Cloud instances with overly permissive security groups
- Missing infrastructure-as-code security policies
Scan for other exposed services. If one Elasticsearch instance was exposed, other services in the same environment may also be publicly accessible. Check for exposed Kibana, Redis, MongoDB, and other database services.