Alerts
The Alerts module is the central hub for managing security findings across your entire ShadowMap deployment. Every exposure discovered by ShadowMap's 27+ scanning sources — from open ports and weak SSL to dark web mentions and leaked credentials — surfaces here as an alert for investigation and response.
Overview
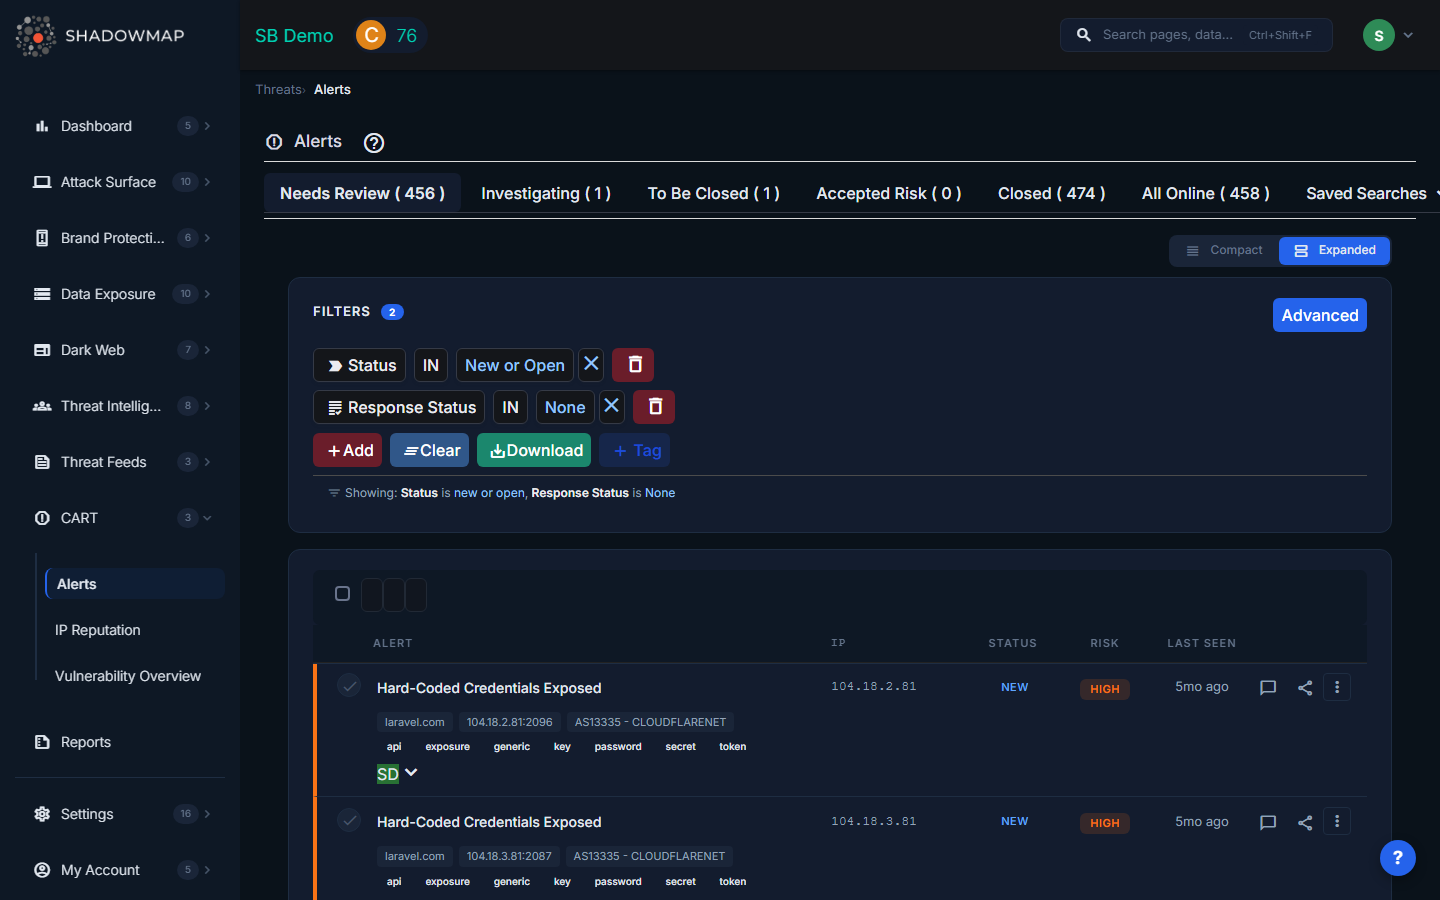
The Alerts view shows a filterable, sortable list of all security findings. The summary strip at the top shows counts by status:
- Needs Review — New alerts with no response action taken
- Investigating — Alerts your team is actively working on
- To Be Closed — Alerts marked for closure
- Closed — Resolved alerts
- Accepted Risk — Risks formally accepted by your organization
- All Online — All active (non-closed) alerts
Alert Statuses
Alerts have two status dimensions:
Internal Status (Alert Lifecycle)
| Status | Meaning |
|---|---|
| New | Recently discovered by a scan |
| Open | Acknowledged, still requires action |
| Closed | Resolved or no longer detected in scans |
| Reopened | Previously closed but detected again |
Response Status (Your Team's Action)
| Status | Color | Meaning |
|---|---|---|
| None | Gray | No action taken yet — needs review |
| Reviewed | Green | Reviewed by the team, no immediate action required |
| Investigating | Purple | Team is actively investigating |
| Public | Orange | Known/documented exposure (intentional) |
| To Be Closed | Yellow | Remediation complete, pending verification |
| Accepted Risk | Red | Risk formally accepted by the organization |
To change a response status, select one or more alerts and use the Change Status button, or change it from the alert detail view's sidebar.
Understanding the List View
Each alert row shows:
| Column | Description |
|---|---|
| Alert | Finding title — click to open the detail view |
| IP | IP address associated with the finding |
| Status | Internal status (New/Open/Closed/Reopened) |
| Risk | Severity level with colored badge |
| Last Seen | When the alert was most recently detected ("2 hours ago") |
| Actions | Quick-access buttons for comments, sharing, and more |
Expand a row to see additional metadata: hostname, port, ASN provider, geolocation with country flag.
Risk Levels
Risk levels are based on CVSS scoring:
| Level | CVSS Score | Color | What It Means |
|---|---|---|---|
| High | 8.0 – 10.0 | Red | Critical exposure requiring immediate attention |
| Medium | 5.0 – 7.9 | Orange | Significant risk that should be addressed promptly |
| Low | 2.0 – 4.9 | Yellow | Minor risk, address when possible |
| Informational | 0.0 – 1.9 | Green | For awareness only, no immediate risk |
Filtering and Search
The filter panel supports 17+ filter types:
| Filter | Description |
|---|---|
| Title | Text search across alert titles |
| Status | Internal status (New, Open, Closed, Reopened) |
| Response Status | Your team's response action |
| Risk | Severity level |
| Assigned To | User or team assignment |
| SLA Policy Violation | Alerts violating specific SLA policies |
| Tag Rule | Automatically applied tag rules |
| Host | Domain or hostname |
| IP | IP address |
| Country | Geolocation country |
| ASN | Autonomous System provider |
| Port | Service port number |
| Added On | Alert creation date range |
| Last Seen On | Most recent detection date range |
| CVE ID | Specific CVE identifier |
| CWE ID | Weakness category |
| EPSS Score | Exploit prediction score |
| Custom Tags | Any user-defined tags |
Saved Searches
ShadowMap includes pre-built saved searches for common views:
- Needs Review — New/Open alerts with no response status
- Investigating — Alerts being actively investigated
- Accepted Risk — Formally accepted risks
- Closed — Resolved alerts
You can also create custom saved searches from any filter combination.
Alert Detail View
Click any alert to open its full detail view.
Details Sidebar
The right sidebar shows key metadata:
- Risk Score — CVSS numeric score
- Risk Level — High/Medium/Low/Informational
- Status — Internal status
- Response Status — Dropdown to change response action
- Assignee — Dropdown to assign to a team member
- Host, IP, Port — Affected asset details
- ASN — Network provider
- Location — Country with flag
Classification
When available, alerts include:
- CVE ID — The specific vulnerability identifier
- CWE ID — The weakness category
- CVSS Score — Severity rating (0-10)
- CVSS Metrics — Attack vector, complexity, privileges required
- EPSS Score — Probability the vulnerability will be exploited
Investigation Tabs
| Tab | Content |
|---|---|
| About This Vulnerability | Description, impact analysis, external references |
| Recommendation | Remediation steps and best practices |
| Sub Domains | All domains/hosts affected by this alert |
| Applications | Web applications affected (with risk level, status, first/last seen) |
| Activity Logs | Timeline of all actions taken — status changes, assignments, comments, shares |
Depending on the alert source, additional tabs may appear with source-specific data (DNS Recursion, Security Headers, RDP Bluekeep, S3 Bucket details, IP Reputation, SSL analysis, etc.).
Screenshot / Proof of Concept
When available, alerts include a screenshot or proof-of-concept image from the scan source. Click to expand.
Taking Action on Alerts
Individual Actions
From the alert detail view:
- Change Response Status — Mark as Reviewed, Investigating, Accepted Risk, etc.
- Assign — Assign to a team member or team
- Comment — Add investigation notes (with comment templates for quick responses)
- Add Tags — Apply custom key-value tags for organization
- Share — Send via email or integrations (Slack, Jira, PagerDuty)
Bulk Actions
Select multiple alerts using checkboxes, then:
- Change Status — Set response status for all selected
- Assign — Assign all selected to a user or team
- Add Tags — Apply tags to all selected
- Share — Share all selected via email or integration
- Export — Export filtered alerts to Excel or JSON
Sharing Alerts
Via Email
Share individual or bulk alerts by email. Recipients receive:
- Alert title and summary
- Risk level, status, host, IP details
- Direct link to the alert in ShadowMap
Via Integrations
Share alerts to connected tools:
| Integration | What Happens |
|---|---|
| Slack | Sends formatted message with alert details to configured channel |
| Jira | Creates a ticket with alert details, classification, and link back |
| PagerDuty | Creates an incident with severity mapping |
| ArcSight (SIEM) | Sends CEF-formatted security event |
Configure integrations under Settings > Integrations.
How Alerts Connect to SLA Policies
When an SLA Policy is configured, alerts matching the policy criteria are tracked against response time targets. If the SLA threshold is exceeded, the alert appears in SLA Violations and escalation notifications are triggered.
ShadowMap includes alert coalescing to prevent notification storms — if more than 10 violations for a single policy occur within 5 minutes, subsequent alerts are batched into a single digest notification instead of individual alerts.
Alert Sources
Alerts are generated from 27+ scanning sources across these categories:
| Category | Examples |
|---|---|
| Application | Web vulnerabilities, missing security headers, default credentials, path brute-force |
| Network | Open ports, zone transfers, anonymous FTP, RDP Bluekeep |
| Malware & Reputation | Cryptocurrency miners, Google Safe Browsing, IP blacklists, honeypot detection |
| SSL/TLS | Expired certificates, weak cipher suites, protocol vulnerabilities |
| DNS | SPF/DKIM/DMARC issues, open resolvers, DNSSEC failures |
Alert Deduplication
ShadowMap deduplicates alerts using a hash of: IP + Host + Port + Path + Source + Title. If the same exposure is detected across multiple scans, it updates the existing alert's "Last Seen" timestamp rather than creating a duplicate.
If an alert was previously closed and the same exposure is detected again, the alert is reopened (status changes to Reopened).
Exporting Alerts
- Apply your desired filters
- Click Export
- Select format: Excel or JSON
- The export runs as a background task — you'll see a progress indicator
- Download the file when complete
Exports include all applied filters, so you get exactly the subset you were viewing.
Common Questions
Q: Why did an alert get reopened?
An alert is reopened when it was previously marked as Closed but ShadowMap's scanners detected the same exposure again in a new scan. This typically means the remediation was incomplete or the issue has recurred.
Q: What does "Accepted Risk" mean vs "Closed"?
Closed means the exposure has been remediated and is no longer detected. Accepted Risk means the exposure still exists but your organization has made a deliberate decision to accept it (e.g., a low-risk open port that serves a legitimate business purpose). Accepted Risk alerts are excluded from SLA violation tracking.
Q: How do I stop getting overwhelmed by alert volume?
- Use Saved Searches to focus on what matters (e.g., "High risk + Needs Review")
- Set up SLA Policies to prioritize by severity
- Use Tag Rules to auto-categorize alerts
- Assign alerts to specific team members to distribute the workload
- Set up integrations so alerts flow into your existing workflow tools (Jira, Slack)
Q: How do I send alerts to my SIEM?
Configure an ArcSight (SIEM) integration under Settings > Integrations. Alerts can then be shared to your SIEM individually, in bulk, or automatically via SLA policy notifications.
Related
- Dashboard Overview — Summary of active alerts
- SLA Violations — Alerts exceeding response time targets
- SLA Policies — Configure response time targets and escalation
- Integrations — Connect Slack, Jira, PagerDuty, SIEM
- Vulnerability Overview — CVE-focused view of vulnerabilities
- IP Reputation — Reputation scoring for your IPs